Examples of Working with the Chart
Examples of Working with the Chart
图表操作的示例
本节包含关于图表属性操作的示例。每个属性都展示了一个或两个完整的函数。这些函数允许设置或接收属性的值。这些函数在自定义mql4应用程序中可以“原样”使用。
下面的截图展示了图形面板,说明了更改图表属性如何改变其外观。点击“下一步”按钮可以设置相应属性的新值,并查看图表窗口中的变化。
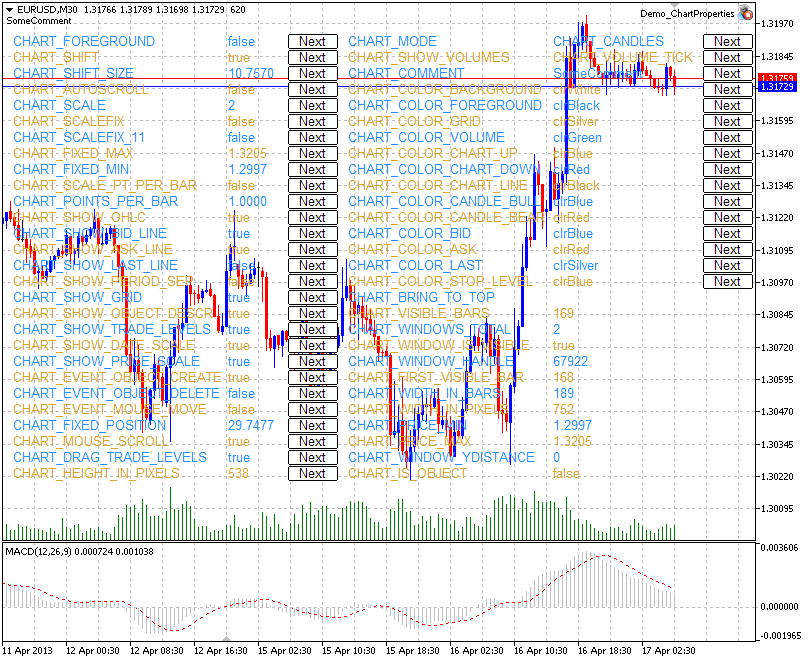
面板的源代码位于下方。
图表属性及使用它们的示例函数
- CHART_BRING_TO_TOP将图表显示在所有其他图表之上。
//+----------------------------------------------------------------------+
//| Send command to the terminal to display the chart above all others.  |
//+----------------------------------------------------------------------+
bool ChartBringToTop(const long chart_ID=0)
  {
//--- reset the error value
   ResetLastError();
//--- show the chart on top of all others
   if(!ChartSetInteger(chart_ID,CHART_BRING_TO_TOP,0,true))
     {
      //--- display the error message in Experts journal
      Print(__FUNCTION__+", Error Code = ",GetLastError());
      return(false);
     }
//--- successful execution
   return(true);
}- CHART_MOUSE_SCROLL是用于使用左键滚动图表的属性。
//+--------------------------------------------------------------------------+
//| The function defines if scrolling the chart using left mouse button is   |
//| enabled.                                                                 |
//+--------------------------------------------------------------------------+
bool ChartMouseScrollGet(bool &result,const long chart_ID=0)
  {
//--- prepare the variable to get the property value
   long value;
//--- reset the error value
   ResetLastError();
//--- receive the property value
   if(!ChartGetInteger(chart_ID,CHART_MOUSE_SCROLL,0,value))
     {
      //--- display the error message in Experts journal
      Print(__FUNCTION__+", Error Code = ",GetLastError());
      return(false);
     }
//--- store the value of the chart property in memory
   result=value;
//--- successful execution
   return(true);
  }
//+--------------------------------------------------------------------+
//| The function enables/disables scrolling the chart using left mouse |
//| button.                                                            |
//+--------------------------------------------------------------------+
bool ChartMouseScrollSet(const bool value,const long chart_ID=0)
  {
//--- reset the error value
   ResetLastError();
//--- set property value
   if(!ChartSetInteger(chart_ID,CHART_MOUSE_SCROLL,0,value))
     {
      //--- display the error message in Experts journal
      Print(__FUNCTION__+", Error Code = ",GetLastError());
      return(false);
     }
//--- successful execution
   return(true);
}- CHART_EVENT_MOUSE_MOVE是向mql4应用程序发送关于移动事件和鼠标点击的消息的属性(CHARTEVENT_MOUSE_MOVE)。
//+------------------------------------------------------------------+
//| Check if messages concerning move events and mouse clicks        |
//| are sent to all mql4 applications on the chart.                  |
//+------------------------------------------------------------------+
bool ChartEventMouseMoveGet(bool &result,const long chart_ID=0)
  {
//--- prepare the variable to get the property value
   long value;
//--- reset the error value
   ResetLastError();
//--- receive the property value
   if(!ChartGetInteger(chart_ID,CHART_EVENT_MOUSE_MOVE,0,value))
     {
      //--- display the error message in Experts journal
      Print(__FUNCTION__+", Error Code = ",GetLastError());
      return(false);
     }
//--- store the value of the chart property in memory
   result=value;
//--- successful execution
   return(true);
  }
//+------------------------------------------------------------------------------+
//| The function enables/disables the mode of sending messages concerning move   |
//| events and mouse clicks to mql4 applications on the                          |
//| chart.                                                                       |
//+------------------------------------------------------------------------------+
bool ChartEventMouseMoveSet(const bool value,const long chart_ID=0)
  {
//--- reset the error value
   ResetLastError();
//--- set property value
   if(!ChartSetInteger(chart_ID,CHART_EVENT_MOUSE_MOVE,0,value))
     {
      //--- display the error message in Experts journal
      Print(__FUNCTION__+", Error Code = ",GetLastError());
      return(false);
     }
//--- successful execution
   return(true);
}- CHART_EVENT_OBJECT_CREATE是向mql4应用程序发送关于图形对象创建事件的消息的属性(CHARTEVENT_OBJECT_CREATE)。
//+---------------------------------------------------------------------+
//| Check if messages concerning the event of a graphic object creation |
//| are sent to all mql4 applications on the chart.                     |
//+---------------------------------------------------------------------+
bool ChartEventObjectCreateGet(bool &result,const long chart_ID=0)
  {
//--- prepare the variable to get the property value
   long value;
//--- reset the error value
   ResetLastError();
//--- receive the property value
   if(!ChartGetInteger(chart_ID,CHART_EVENT_OBJECT_CREATE,0,value))
     {
      //--- display the error message in Experts journal
      Print(__FUNCTION__+", Error Code = ",GetLastError());
      return(false);
     }
//--- store the value of the chart property in memory
   result=value;
//--- successful execution
   return(true);
  }
//+--------------------------------------------------------------------------+
//| The function enables/disables the mode of sending messages concerning    |
//| the event of a graphic object creation to all mql4 applications on the   |
//| chart.                                                                   |
//+--------------------------------------------------------------------------+
bool ChartEventObjectCreateSet(const bool value,const long chart_ID=0)
  {
//--- reset the error value
   ResetLastError();
//--- set property value
   if(!ChartSetInteger(chart_ID,CHART_EVENT_OBJECT_CREATE,0,value))
     {
      //--- display the error message in Experts journal
      Print(__FUNCTION__+", Error Code = ",GetLastError());
      return(false);
     }
//--- successful execution
   return(true);
}- CHART_EVENT_OBJECT_DELETE是向mql4应用程序发送关于图形对象删除事件的消息的属性(CHARTEVENT_OBJECT_DELETE)。
//+---------------------------------------------------------------------+
//| Check if messages concerning the event of a graphic object deletion |
//| are sent to all mql4 applications on the chart.                     |
//+---------------------------------------------------------------------+
bool ChartEventObjectDeleteGet(bool &result,const long chart_ID=0)
  {
//--- prepare the variable to get the property value
   long value;
//--- reset the error value
   ResetLastError();
//--- receive the property value
   if(!ChartGetInteger(chart_ID,CHART_EVENT_OBJECT_DELETE,0,value))
     {
      //--- display the error message in Experts journal
      Print(__FUNCTION__+", Error Code = ",GetLastError());
      return(false);
     }
//--- store the value of the chart property in memory
   result=value;
//--- successful execution
   return(true);
  }
//+--------------------------------------------------------------------------+
//| The function enables/disables the mode of sending messages concerning    |
//| the event of a graphic object deletion to all mql4 applications on the   |
//| chart.                                                                   |
//+--------------------------------------------------------------------------+
bool ChartEventObjectDeleteSet(const bool value,const long chart_ID=0)
  {
//--- reset the error value
   ResetLastError();
//--- set property value
   if(!ChartSetInteger(chart_ID,CHART_EVENT_OBJECT_DELETE,0,value))
     {
      //--- display the error message in Experts journal
      Print(__FUNCTION__+", Error Code = ",GetLastError());
      return(false);
     }
//--- successful execution
   return(true);
}- CHART_MODE – 图表的类型(蜡烛图、条形图或折线图)。
//+------------------------------------------------------------------+
//| Get chart display type (candlesticks, bars or                    |
//| line).                                                           |
//+------------------------------------------------------------------+
ENUM_CHART_MODE ChartModeGet(const long chart_ID=0)
  {
//--- prepare the variable to get the property value
   long result=WRONG_VALUE;
//--- reset the error value
   ResetLastError();
//--- receive the property value
   if(!ChartGetInteger(chart_ID,CHART_MODE,0,result))
     {
      //--- display the error message in Experts journal
      Print(__FUNCTION__+", Error Code = ",GetLastError());
     }
//--- return the value of the chart property
   return((ENUM_CHART_MODE)result);
  }
//+------------------------------------------------------------------+
//| Set chart display type (candlesticks, bars or                    |
//| line).                                                           |
//+------------------------------------------------------------------+
bool ChartModeSet(const long value,const long chart_ID=0)
  {
//--- reset the error value
   ResetLastError();
//--- set property value
   if(!ChartSetInteger(chart_ID,CHART_MODE,value))
     {
      //--- display the error message in Experts journal
      Print(__FUNCTION__+", Error Code = ",GetLastError());
      return(false);
     }
//--- successful execution
   return(true);
}- CHART_FOREGROUND是使价格图表在前景中显示的属性。
//+------------------------------------------------------------------+
//| The function defines if a price chart is displayed in the        |
//| foreground.                                                      |
//+------------------------------------------------------------------+
bool ChartForegroundGet(bool &result,const long chart_ID=0)
  {
//--- prepare the variable to get the property value
   long value;
//--- reset the error value
   ResetLastError();
//--- receive the property value
   if(!ChartGetInteger(chart_ID,CHART_FOREGROUND,0,value))
     {
      //--- display the error message in Experts journal
      Print(__FUNCTION__+", Error Code = ",GetLastError());
      return(false);
     }
//--- store the value of the chart property in memory
   result=value;
//--- successful execution
   return(true);
  }
//+---------------------------------------------------------------------------+
//| The function enables/disables the mode of displaying a price chart on the |
//| foreground.                                                               |
//+---------------------------------------------------------------------------+
bool ChartForegroundSet(const bool value,const long chart_ID=0)
  {
//--- reset the error value
   ResetLastError();
//--- set property value
   if(!ChartSetInteger(chart_ID,CHART_FOREGROUND,0,value))
     {
      //--- display the error message in Experts journal
      Print(__FUNCTION__+", Error Code = ",GetLastError());
      return(false);
     }
//--- successful execution
   return(true);
}- CHART_SHIFT – 价格图表从右侧边缘移动的模式。
//+------------------------------------------------------------------------------------+
//| The function defines if the mode of shift of the price chart from the right border |
//| is enabled.                                                                        |
//+------------------------------------------------------------------------------------+
bool ChartShiftGet(bool &result,const long chart_ID=0)
  {
//--- prepare the variable to get the property value
   long value;
//--- reset the error value
   ResetLastError();
//--- receive the property value
   if(!ChartGetInteger(chart_ID,CHART_SHIFT,0,value))
     {
      //--- display the error message in Experts journal
      Print(__FUNCTION__+", Error Code = ",GetLastError());
      return(false);
     }
//--- store the value of the chart property in memory
   result=value;
//--- successful execution
   return(true);
  }
//+--------------------------------------------------------------------------+
//| The function enables/disables the mode of displaying a price chart with  |
//| a shift from the right border.                                           |
//+--------------------------------------------------------------------------+
bool ChartShiftSet(const bool value,const long chart_ID=0)
  {
//--- reset the error value
   ResetLastError();
//--- set property value
   if(!ChartSetInteger(chart_ID,CHART_SHIFT,0,value))
     {
      //--- display the error message in Experts journal
      Print(__FUNCTION__+", Error Code = ",GetLastError());
      return(false);
     }
//--- successful execution
   return(true);
}- CHART_AUTOSCROLL – 图表自动移动到右侧边缘的模式。
//+---------------------------------------------------------------------+
//| The function defines if the mode of the autoscroll                  |
//| of the chart to the right in case of new ticks' arrival is enabled. |
//+---------------------------------------------------------------------+
bool ChartAutoscrollGet(bool &result,const long chart_ID=0)
  {
//--- prepare the variable to get the property value
   long value;
//--- reset the error value
   ResetLastError();
//--- receive the property value
   if(!ChartGetInteger(chart_ID,CHART_AUTOSCROLL,0,value))
     {
      //--- display the error message in Experts journal
      Print(__FUNCTION__+", Error Code = ",GetLastError());
      return(false);
     }
//--- store the value of the chart property in memory
   result=value;
//--- successful execution
   return(true);
  }
//+------------------------------------------------------------------+
//| The function enables/disables the mode of the autoscroll         |
//| of the chart to the right in case of new ticks' arrival.         |
//+------------------------------------------------------------------+
bool ChartAutoscrollSet(const bool value,const long chart_ID=0)
  {
//--- reset the error value
   ResetLastError();
//--- set property value
   if(!ChartSetInteger(chart_ID,CHART_AUTOSCROLL,0,value))
     {
      //--- display the error message in Experts journal
      Print(__FUNCTION__+", Error Code = ",GetLastError());
      return(false);
     }
//--- successful execution
   return(true);
}- CHART_SCALE – 图表比例属性。
//+------------------------------------------------------------------+
//| Get chart scale (from 0 to 5).                                   |
//+------------------------------------------------------------------+
int ChartScaleGet(const long chart_ID=0)
  {
//--- prepare the variable to get the property value
   long result=-1;
//--- reset the error value
   ResetLastError();
//--- receive the property value
   if(!ChartGetInteger(chart_ID,CHART_SCALE,0,result))
     {
      //--- display the error message in Experts journal
      Print(__FUNCTION__+", Error Code = ",GetLastError());
     }
//--- return the value of the chart property
   return((int)result);
  }
//+------------------------------------------------------------------+
//| Set chart scale (from 0 to 5).                                   |
//+------------------------------------------------------------------+
bool ChartScaleSet(const long value,const long chart_ID=0)
  {
//--- reset the error value
   ResetLastError();
//--- set property value
   if(!ChartSetInteger(chart_ID,CHART_SCALE,0,value))
     {
      //--- display the error message in Experts journal
      Print(__FUNCTION__+", Error Code = ",GetLastError());
      return(false);
     }
//--- successful execution
   return(true);
}- CHART_SCALEFIX – 固定图表比例的模式。
//+------------------------------------------------------------------+
//| The function defines if the fixed scale mode is enabled.         |
//+------------------------------------------------------------------+
bool ChartScaleFixGet(bool &result,const long chart_ID=0)
  {
//--- prepare the variable to get the property value
   long value;
//--- reset the error value
   ResetLastError();
//--- receive the property value
   if(!ChartGetInteger(chart_ID,CHART_SCALEFIX,0,value))
     {
      //--- display the error message in Experts journal
      Print(__FUNCTION__+", Error Code = ",GetLastError());
      return(false);
     }
//--- store the value of the chart property in memory
   result=value;
//--- successful execution
   return(true);
  }
//+------------------------------------------------------------------+
//| The function enables/disables the fixed scale mode.              |
//+------------------------------------------------------------------+
bool ChartScaleFixSet(const bool value,const long chart_ID=0)
  {
//--- reset the error value
   ResetLastError();
//--- set property value
   if(!ChartSetInteger(chart_ID,CHART_SCALEFIX,0,value))
     {
      //--- display the error message in Experts journal
      Print(__FUNCTION__+", Error Code = ",GetLastError());
      return(false);
     }
//--- successful execution
   return(true);
}- CHART_SCALEFIX_11 – 1:1图表比例模式。
//+------------------------------------------------------------------+
//| The function defines if "1:1" scale is enabled.                  |
//+------------------------------------------------------------------+
bool ChartScaleFix11Get(bool &result,const long chart_ID=0)
  {
//--- prepare the variable to get the property value
   long value;
//--- reset the error value
   ResetLastError();
//--- receive the property value
   if(!ChartGetInteger(chart_ID,CHART_SCALEFIX_11,0,value))
     {
      //--- display the error message in Experts journal
      Print(__FUNCTION__+", Error Code = ",GetLastError());
      return(false);
     }
//--- store the value of the chart property in memory
   result=value;
//--- successful execution
   return(true);
  }
//+------------------------------------------------------------------+
//| The function enables/disables "1:1" scale mode                   |
//+------------------------------------------------------------------+
bool ChartScaleFix11Set(const bool value,const long chart_ID=0)
  {
//--- reset the error value
   ResetLastError();
//--- set property value
   if(!ChartSetInteger(chart_ID,CHART_SCALEFIX_11,0,value))
     {
      //--- display the error message in Experts journal
      Print(__FUNCTION__+", Error Code = ",GetLastError());
      return(false);
     }
//--- successful execution
   return(true);
}- CHART_SCALE_PT_PER_BAR – 以每条形图点数指定图表比例的模式。
//+------------------------------------------------------------------------------+
//| The function defines if the mode of specifying the chart scale in points per |
//| bar is enabled.                                                              |
//+------------------------------------------------------------------------------+
bool ChartScalePerBarGet(bool &result,const long chart_ID=0)
  {
//--- prepare the variable to get the property value
   long value;
//--- reset the error value
   ResetLastError();
//--- receive the property value
   if(!ChartGetInteger(chart_ID,CHART_SCALE_PT_PER_BAR,0,value))
     {
      //--- display the error message in Experts journal
      Print(__FUNCTION__+", Error Code = ",GetLastError());
      return(false);
     }
//--- store the value of the chart property in memory
   result=value;
//--- successful execution
   return(true);
  }
//+------------------------------------------------------------------------------------+
//| The function enables/disables the mode of specifying the chart scale in points per |
//| bar.                                                                               |
//+------------------------------------------------------------------------------------+
bool ChartScalePerBarSet(const bool value,const long chart_ID=0)
  {
//--- reset the error value
   ResetLastError();
//--- set property value
   if(!ChartSetInteger(chart_ID,CHART_SCALE_PT_PER_BAR,0,value))
     {
      //--- display the error message in Experts journal
      Print(__FUNCTION__+", Error Code = ",GetLastError());
      return(false);
     }
//--- successful execution
   return(true);
}- CHART_SHOW_OHLC – 在左上角显示OHLC值的属性。
//+------------------------------------------------------------------+
//| The function defines if the mode of displaying OHLC values       |
//| in the upper left corner is enabled.                             |
//+------------------------------------------------------------------+
bool ChartShowOHLCGet(bool &result,const long chart_ID=0)
  {
//--- prepare the variable to get the property value
   long value;
//--- reset the error value
   ResetLastError();
//--- receive the property value
   if(!ChartGetInteger(chart_ID,CHART_SHOW_OHLC,0,value))
     {
      //--- display the error message in Experts journal
      Print(__FUNCTION__+", Error Code = ",GetLastError());
      return(false);
     }
//--- store the value of the chart property in memory
   result=value;
//--- successful execution
   return(true);
  }
//+--------------------------------------------------------------------------+
//| The function enables/disables the mode of displaying OHLC values in the  |
//| upper left corner of the chart.                                          |
//+--------------------------------------------------------------------------+
bool ChartShowOHLCSet(const bool value,const long chart_ID=0)
  {
//--- reset the error value
   ResetLastError();
//--- set property value
   if(!ChartSetInteger(chart_ID,CHART_SHOW_OHLC,0,value))
     {
      //--- display the error message in Experts journal
      Print(__FUNCTION__+", Error Code = ",GetLastError());
      return(false);
     }
//--- successful execution
   return(true);
}- CHART_SHOW_BID_LINE – 在图表上以水平线显示Bid值的属性。
//+-----------------------------------------------------------------------------+
//| The function defines if the mode of displaying Bid value line on the chart  |
//| is enabled.                                                                 |
//+-----------------------------------------------------------------------------+
bool ChartShowBidLineGet(bool &result,const long chart_ID=0)
  {
//--- prepare the variable to get the property value
   long value;
//--- reset the error value
   ResetLastError();
//--- receive the property value
   if(!ChartGetInteger(chart_ID,CHART_SHOW_BID_LINE,0,value))
     {
      //--- display the error message in Experts journal
      Print(__FUNCTION__+", Error Code = ",GetLastError());
      return(false);
     }
//--- store the value of the chart property in memory
   result=value;
//--- successful execution
   return(true);
  }
//+--------------------------------------------------------------------+
//| The function enables/disables the mode of displaying Bid line on a |
//| chart.                                                             |
//+--------------------------------------------------------------------+
bool ChartShowBidLineSet(const bool value,const long chart_ID=0)
  {
//--- reset the error value
   ResetLastError();
//--- set property value
   if(!ChartSetInteger(chart_ID,CHART_SHOW_BID_LINE,0,value))
     {
      //--- display the error message in Experts journal
      Print(__FUNCTION__+", Error Code = ",GetLastError());
      return(false);
     }
//--- successful execution
   return(true);
}- CHART_SHOW_ASK_LINE – 在图表上以水平线显示Ask值的属性。
//+-----------------------------------------------------------------------+
//| The function defines if the mode of displaying Ask value line on the  |
//| chart.                                                                |
//+-----------------------------------------------------------------------+
bool ChartShowAskLineGet(bool &result,const long chart_ID=0)
  {
//--- prepare the variable to get the property value
   long value;
//--- reset the error value
   ResetLastError();
//--- receive the property value
   if(!ChartGetInteger(chart_ID,CHART_SHOW_ASK_LINE,0,value))
     {
      //--- display the error message in Experts journal
      Print(__FUNCTION__+", Error Code = ",GetLastError());
      return(false);
     }
//--- store the value of the chart property in memory
   result=value;
//--- successful execution
   return(true);
  }
//+-----------------------------------------------------------------------+
//| The function enables/disables the mode of displaying Ask line on the  |
//| chart.                                                                |
//+-----------------------------------------------------------------------+
bool ChartShowAskLineSet(const bool value,const long chart_ID=0)
  {
//--- reset the error value
   ResetLastError();
//--- set property value
   if(!ChartSetInteger(chart_ID,CHART_SHOW_ASK_LINE,0,value))
     {
      //--- display the error message in Experts journal
      Print(__FUNCTION__+", Error Code = ",GetLastError());
      return(false);
     }
//--- successful execution
   return(true);
}- CHART_SHOW_LAST_LINE – 在图表上以水平线显示Last值的属性。
//+---------------------------------------------------------------------------------+
//| The function defines if the mode of displaying the line for the last performed  |
//| deal's price is enabled.                                                        |
//+---------------------------------------------------------------------------------+
bool ChartShowLastLineGet(bool &result,const long chart_ID=0)
  {
//--- prepare the variable to get the property value
   long value;
//--- reset the error value
   ResetLastError();
//--- receive the property value
   if(!ChartGetInteger(chart_ID,CHART_SHOW_LAST_LINE,0,value))
     {
      //--- display the error message in Experts journal
      Print(__FUNCTION__+", Error Code = ",GetLastError());
      return(false);
     }
//--- store the value of the chart property in memory
   result=value;
//--- successful execution
   return(true);
  }
//+--------------------------------------------------------------------------------------+
//| The function enables/disables the mode of displaying the line for the last performed |
//| deal's price.                                                                        |
//+--------------------------------------------------------------------------------------+
bool ChartShowLastLineSet(const bool value,const long chart_ID=0)
  {
//--- reset the error value
   ResetLastError();
//--- set property value
   if(!ChartSetInteger(chart_ID,CHART_SHOW_LAST_LINE,0,value))
     {
      //--- display the error message in Experts journal
      Print(__FUNCTION__+", Error Code = ",GetLastError());
      return(false);
     }
//--- successful execution
   return(true);
}- CHART_SHOW_PERIOD_SEP – 显示相邻时期之间的垂直分隔线的属性。
//+------------------------------------------------------------------+
//| The function defines if the mode of displaying vertical          |
//| separators between adjacent periods is enabled.                  |
//+------------------------------------------------------------------+
bool ChartShowPeriodSeparatorGet(bool &result,const long chart_ID=0)
  {
//--- prepare the variable to get the property value
   long value;
//--- reset the error value
   ResetLastError();
//--- receive the property value
   if(!ChartGetInteger(chart_ID,CHART_SHOW_PERIOD_SEP,0,value))
     {
      //--- display the error message in Experts journal
      Print(__FUNCTION__+", Error Code = ",GetLastError());
      return(false);
     }
//--- store the value of the chart property in memory
   result=value;
//--- successful execution
   return(true);
  }
//+------------------------------------------------------------------+
//| The function enables/disables the mode of displaying vertical    |
//| separators between adjacent periods.                             |
//+------------------------------------------------------------------+
bool ChartShowPeriodSepapatorSet(const bool value,const long chart_ID=0)
  {
//--- reset the error value
   ResetLastError();
//--- set property value
   if(!ChartSetInteger(chart_ID,CHART_SHOW_PERIOD_SEP,0,value))
     {
      //--- display the error message in Experts journal
      Print(__FUNCTION__+", Error Code = ",GetLastError());
      return(false);
     }
//--- successful execution
   return(true);
}- CHART_SHOW_GRID – 显示图表网格的属性。
//+------------------------------------------------------------------+
//| The function defines if the chart grid is displayed.             |
//+------------------------------------------------------------------+
bool ChartShowGridGet(bool &result,const long chart_ID=0)
  {
//--- prepare the variable to get the property value
   long value;
//--- reset the error value
   ResetLastError();
//--- receive the property value
   if(!ChartGetInteger(chart_ID,CHART_SHOW_GRID,0,value))
     {
      //--- display the error message in Experts journal
      Print(__FUNCTION__+", Error Code = ",GetLastError());
      return(false);
     }
//--- store the value of the chart property in memory
   result=value;
//--- successful execution
   return(true);
  }
//+------------------------------------------------------------------+
//| The function enables/disables the chart grid.                    |
//+------------------------------------------------------------------+
bool ChartShowGridSet(const bool value,const long chart_ID=0)
  {
//--- reset the error value
   ResetLastError();
//--- set the property value
   if(!ChartSetInteger(chart_ID,CHART_SHOW_GRID,0,value))
     {
      //--- display the error message in Experts journal
      Print(__FUNCTION__+", Error Code = ",GetLastError());
      return(false);
     }
//--- successful execution
   return(true);
}- CHART_SHOW_VOLUMES – 在图表上显示交易量的属性。
//+------------------------------------------------------------------------+
//| The function defines if the volumes are displayed on a chart (are not  |
//| displayed, tick ones are displayed, actual ones are displayed).        |
//+------------------------------------------------------------------------+
ENUM_CHART_VOLUME_MODE ChartShowVolumesGet(const long chart_ID=0)
  {
//--- prepare the variable to get the property value
   long result=WRONG_VALUE;
//--- reset the error value
   ResetLastError();
//--- receive the property value
   if(!ChartGetInteger(chart_ID,CHART_SHOW_VOLUMES,0,result))
     {
      //--- display the error message in Experts journal
      Print(__FUNCTION__+", Error Code = ",GetLastError());
     }
//--- return the value of the chart property
   return((ENUM_CHART_VOLUME_MODE)result);
  }
//+------------------------------------------------------------------+
//| The function sets the mode of displaying the volumes on a chart. |
//+------------------------------------------------------------------+
bool ChartShowVolumesSet(const long value,const long chart_ID=0)
  {
//--- reset the error value
   ResetLastError();
//--- set property value
   if(!ChartSetInteger(chart_ID,CHART_SHOW_VOLUMES,value))
     {
      //--- display the error message in Experts journal
      Print(__FUNCTION__+", Error Code = ",GetLastError());
      return(false);
     }
//--- successful execution
   return(true);
}- CHART_SHOW_OBJECT_DESCR – 图形对象弹出描述的属性。
//+-------------------------------------------------------------------+
//| The function defines if pop-up descriptions                       |
//| of graphical objects are displayed when hovering mouse over them. |
//+-------------------------------------------------------------------+
bool ChartShowObjectDescriptionGet(bool &result,const long chart_ID=0)
  {
//--- prepare the variable to get the property value
   long value;
//--- reset the error value
   ResetLastError();
//--- receive the property value
   if(!ChartGetInteger(chart_ID,CHART_SHOW_OBJECT_DESCR,0,value))
     {
      //--- display the error message in Experts journal
      Print(__FUNCTION__+", Error Code = ",GetLastError());
      return(false);
     }
//--- store the value of the chart property in memory
   result=value;
//--- successful execution
   return(true);
  }
//+--------------------------------------------------------------------------+
//| The function enables/disables the mode of displaying pop-up descriptions |
//| of graphical objects when hovering mouse over them.                      |
//+--------------------------------------------------------------------------+
bool ChartShowObjectDescriptionSet(const bool value,const long chart_ID=0)
  {
//--- reset the error value
   ResetLastError();
//--- set property value
   if(!ChartSetInteger(chart_ID,CHART_SHOW_OBJECT_DESCR,0,value))
     {
      //--- display the error message in Experts journal
      Print(__FUNCTION__+", Error Code = ",GetLastError());
      return(false);
     }
//--- successful execution
   return(true);
}- CHART_VISIBLE_BARS定义了图表上可供显示的条形图数量。
//+-----------------------------------------------------------------------+
//| The function receives the number of bars that are displayed (visible) |
//| in the chart window.                                                  |
//+-----------------------------------------------------------------------+
int ChartVisibleBars(const long chart_ID=0)
  {
//--- prepare the variable to get the property value
   long result=-1;
//--- reset the error value
   ResetLastError();
//--- receive the property value
   if(!ChartGetInteger(chart_ID,CHART_VISIBLE_BARS,0,result))
     {
      //--- display the error message in Experts journal
      Print(__FUNCTION__+", Error Code = ",GetLastError());
     }
//--- return the value of the chart property
   return((int)result);
}- CHART_WINDOWS_TOTAL定义了包括指标子窗口在内的总图表窗口数量。
//+--------------------------------------------------------------------------+
//| The function gets the total number of chart windows including indicator  |
//| subwindows.                                                              |
//+--------------------------------------------------------------------------+
int ChartWindowsTotal(const long chart_ID=0)
  {
//--- prepare the variable to get the property value
   long result=-1;
//--- reset the error value
   ResetLastError();
//--- receive the property value
   if(!ChartGetInteger(chart_ID,CHART_WINDOWS_TOTAL,0,result))
     {
      //--- display the error message in Experts journal
      Print(__FUNCTION__+", Error Code = ",GetLastError());
     }
//--- return the value of the chart property
   return((int)result);
}- CHART_WINDOW_IS_VISIBLE定义了子窗口的可见性。
//+------------------------------------------------------------------+
//| The function defines if the current chart window or subwindow    |
//| is visible.                                                      |
//+------------------------------------------------------------------+
bool ChartWindowsIsVisible(bool &result,const long chart_ID=0,const int sub_window=0)
  {
//--- prepare the variable to get the property value
   long value;
//--- reset the error value
   ResetLastError();
//--- receive the property value
   if(!ChartGetInteger(chart_ID,CHART_WINDOW_IS_VISIBLE,sub_window,value))
     {
      //--- display the error message in Experts journal
      Print(__FUNCTION__+", Error Code = ",GetLastError());
      return(false);
     }
//--- store the value of the chart property in memory
   result=value;
//--- successful execution
   return(true);
}- CHART_WINDOW_HANDLE返回图表句柄。
//+------------------------------------------------------------------+
//| The function gets the chart handle                               |
//+------------------------------------------------------------------+
int ChartWindowsHandle(const long chart_ID=0)
  {
//--- prepare the variable to get the property value
   long result=-1;
//--- reset the error value
   ResetLastError();
//--- receive the property value
   if(!ChartGetInteger(chart_ID,CHART_WINDOW_HANDLE,0,result))
     {
      //--- display the error message in Experts journal
      Print(__FUNCTION__+", Error Code = ",GetLastError());
     }
//--- return the value of the chart property
   return((int)result);
}- CHART_WINDOW_YDISTANCE定义了指标子窗口的上边框与图表主窗口上边框之间的像素距离。
//+------------------------------------------------------------------+
//| The function gets the distance in pixels between the upper frame |
//| of the subwindow and the upper frame of the chart's main window. |
//+------------------------------------------------------------------+
int ChartWindowsYDistance(const long chart_ID=0,const int sub_window=0)
  {
//--- prepare the variable to get the property value
   long result=-1;
//--- reset the error value
   ResetLastError();
//--- receive the property value
   if(!ChartGetInteger(chart_ID,CHART_WINDOW_YDISTANCE,sub_window,result))
     {
      //--- display the error message in Experts journal
      Print(__FUNCTION__+", Error Code = ",GetLastError());
     }
//--- return the value of the chart property
   return((int)result);
}- CHART_FIRST_VISIBLE_BAR返回图表上第一个可见条形图的数量(条形图索引对应于时间序列)。
//+----------------------------------------------------------------------------+
//| The function receives the number of the first visible bar on the chart.    |
//| Indexing is performed like in time series, last bars have smaller indices. |
//+----------------------------------------------------------------------------+
int ChartFirstVisibleBar(const long chart_ID=0)
  {
//--- prepare the variable to get the property value
   long result=-1;
//--- reset the error value
   ResetLastError();
//--- receive the property value
   if(!ChartGetInteger(chart_ID,CHART_WINDOW_YDISTANCE,0,result))
     {
      //--- display the error message in Experts journal
      Print(__FUNCTION__+", Error Code = ",GetLastError());
     }
//--- return the value of the chart property
   return((int)result);
}- CHART_WIDTH_IN_BARS返回以条形图表示的图表宽度。
//+------------------------------------------------------------------+
//| The function receives the chart width in bars.                   |
//+------------------------------------------------------------------+
int ChartWidthInBars(const long chart_ID=0)
  {
//--- prepare the variable to get the property value
   long result=-1;
//--- reset the error value
   ResetLastError();
//--- receive the property value
   if(!ChartGetInteger(chart_ID,CHART_WIDTH_IN_BARS,0,result))
     {
      //--- display the error message in Experts journal
      Print(__FUNCTION__+", Error Code = ",GetLastError());
     }
//--- return the value of the chart property
   return((int)result);
}- CHART_WIDTH_IN_PIXELS返回以像素表示的图表宽度。
//+------------------------------------------------------------------+
//| The function receives the chart width in pixels.                 |
//+------------------------------------------------------------------+
int ChartWidthInPixels(const long chart_ID=0)
  {
//--- prepare the variable to get the property value
   long result=-1;
//--- reset the error value
   ResetLastError();
//--- receive the property value
   if(!ChartGetInteger(chart_ID,CHART_WIDTH_IN_PIXELS,0,result))
     {
      //--- display the error message in Experts journal
      Print(__FUNCTION__+", Error Code = ",GetLastError());
     }
//--- return the value of the chart property
   return((int)result);
}- CHART_HEIGHT_IN_PIXELS – 以像素表示的图表高度属性。
//+------------------------------------------------------------------+
//| The function receives the chart height value in pixels.          |
//+------------------------------------------------------------------+
int ChartHeightInPixelsGet(const long chart_ID=0,const int sub_window=0)
  {
//--- prepare the variable to get the property value
   long result=-1;
//--- reset the error value
   ResetLastError();
//--- receive the property value
   if(!ChartGetInteger(chart_ID,CHART_HEIGHT_IN_PIXELS,sub_window,result))
     {
      //--- display the error message in Experts journal
      Print(__FUNCTION__+", Error Code = ",GetLastError());
     }
//--- return the value of the chart property
   return((int)result);
  }
//+------------------------------------------------------------------+
//| The function sets the chart height value in pixels.              |
//+------------------------------------------------------------------+
bool ChartHeightInPixelsSet(const int value,const long chart_ID=0,const int sub_window=0)
  {
//--- reset the error value
   ResetLastError();
//--- set property value
   if(!ChartSetInteger(chart_ID,CHART_HEIGHT_IN_PIXELS,sub_window,value))
     {
      //--- display the error message in Experts journal
      Print(__FUNCTION__+", Error Code = ",GetLastError());
      return(false);
     }
//--- successful execution
   return(true);
}- CHART_COLOR_BACKGROUND – 图表背景颜色。
//+------------------------------------------------------------------+
//| The function receives chart background color.                    |
//+------------------------------------------------------------------+
color ChartBackColorGet(const long chart_ID=0)
  {
//--- prepare the variable to receive the color
   long result=clrNONE;
//--- reset the error value
   ResetLastError();
//--- receive chart background color
   if(!ChartGetInteger(chart_ID,CHART_COLOR_BACKGROUND,0,result))
     {
      //--- display the error message in Experts journal
      Print(__FUNCTION__+", Error Code = ",GetLastError());
     }
//--- return the value of the chart property
   return((color)result);
  }
//+------------------------------------------------------------------+
//| The function sets chart background color.                        |
//+------------------------------------------------------------------+
bool ChartBackColorSet(const color clr,const long chart_ID=0)
  {
//--- reset the error value
   ResetLastError();
//--- set the chart background color
   if(!ChartSetInteger(chart_ID,CHART_COLOR_BACKGROUND,clr))
     {
      //--- display the error message in Experts journal
      Print(__FUNCTION__+", Error Code = ",GetLastError());
      return(false);
     }
//--- successful execution
   return(true);
}- CHART_COLOR_FOREGROUND – 轴、比例和OHLC线的颜色。
//+------------------------------------------------------------------+
//| The function receives the color of axes, scale and OHLC line.    |
//+------------------------------------------------------------------+
color ChartForeColorGet(const long chart_ID=0)
  {
//--- prepare the variable to receive the color
   long result=clrNONE;
//--- reset the error value
   ResetLastError();
//--- receive the color of axes, scale and OHLC line
   if(!ChartGetInteger(chart_ID,CHART_COLOR_FOREGROUND,0,result))
     {
      //--- display the error message in Experts journal
      Print(__FUNCTION__+", Error Code = ",GetLastError());
     }
//--- return the value of the chart property
   return((color)result);
  }
//+------------------------------------------------------------------+
//| The function sets the color of axes, scale and OHLC line.        |
//+------------------------------------------------------------------+
bool ChartForeColorSet(const color clr,const long chart_ID=0)
  {
//--- reset the error value
   ResetLastError();
//--- set the color of axes, scale and OHLC line
   if(!ChartSetInteger(chart_ID,CHART_COLOR_FOREGROUND,clr))
     {
      //--- display the error message in Experts journal
      Print(__FUNCTION__+", Error Code = ",GetLastError());
      return(false);
     }
//--- successful execution
   return(true);
}- CHART COLOR_GRID – 图表网格颜色。
//+------------------------------------------------------------------+
//| The function receives chart grid color.                          |
//+------------------------------------------------------------------+
color ChartGridColorGet(const long chart_ID=0)
  {
//--- prepare the variable to receive the color
   long result=clrNONE;
//--- reset the error value
   ResetLastError();
//--- receive chart grid color
   if(!ChartGetInteger(chart_ID,CHART_COLOR_GRID,0,result))
     {
      //--- display the error message in Experts journal
      Print(__FUNCTION__+", Error Code = ",GetLastError());
     }
//--- return the value of the chart property
   return((color)result);
  }
//+------------------------------------------------------------------+
//| The function sets chart grid color.                              |
//+------------------------------------------------------------------+
bool ChartGridColorSet(const color clr,const long chart_ID=0)
  {
//--- reset the error value
   ResetLastError();
//--- set chart grid color
   if(!ChartSetInteger(chart_ID,CHART_COLOR_GRID,clr))
     {
      //--- display the error message in Experts journal
      Print(__FUNCTION__+", Error Code = ",GetLastError());
      return(false);
     }
//--- successful execution
   return(true);
}- CHART COLOR_VOLUMES – 交易量和订单开单水平的颜色。
//+------------------------------------------------------------------+
//| The function receives color of volumes and market entry          |
//| levels.                                                          |
//+------------------------------------------------------------------+
color ChartVolumeColorGet(const long chart_ID=0)
  {
//--- prepare the variable to receive the color
   long result=clrNONE;
//--- reset the error value
   ResetLastError();
//--- receive color of volumes and market entry levels
   if(!ChartGetInteger(chart_ID,CHART_COLOR_VOLUME,0,result))
     {
      //--- display the error message in Experts journal
      Print(__FUNCTION__+", Error Code = ",GetLastError());
     }
//--- return the value of the chart property
   return((color)result);
  }
//+------------------------------------------------------------------+
//| The function sets the color of volumes and market entry          |
//| levels.                                                          |
//+------------------------------------------------------------------+
bool ChartVolumeColorSet(const color clr,const long chart_ID=0)
  {
//--- reset the error value
   ResetLastError();
//--- set color of volumes and market entry levels
   if(!ChartSetInteger(chart_ID,CHART_COLOR_VOLUME,clr))
     {
      //--- display the error message in Experts journal
      Print(__FUNCTION__+", Error Code = ",GetLastError());
      return(false);
     }
//--- successful execution
   return(true);
}- CHART COLOR_CHART_UP – 上升条形图的主体、阴影和边框的颜色。
//+------------------------------------------------------------------+
//| The function receives color of up bar, its shadow and            |
//| border of a bullish candlestick's body.                          |
//+------------------------------------------------------------------+
color ChartUpColorGet(const long chart_ID=0)
  {
//--- prepare the variable to receive the color
   long result=clrNONE;
//--- reset the error value
   ResetLastError();
//--- receive the color of up bar, its shadow and border of bullish candlestick's body
   if(!ChartGetInteger(chart_ID,CHART_COLOR_CHART_UP,0,result))
     {
      //--- display the error message in Experts journal
      Print(__FUNCTION__+", Error Code = ",GetLastError());
     }
//--- return the value of the chart property
   return((color)result);
  }
//+------------------------------------------------------------------+
//| The function sets color of up bar, its shadow and                |
//| border of a bullish candlestick's body.                          |
//+------------------------------------------------------------------+
bool ChartUpColorSet(const color clr,const long chart_ID=0)
  {
//--- reset the error value
   ResetLastError();
//--- set the color of up bar, its shadow and border of body of a bullish candlestick
   if(!ChartSetInteger(chart_ID,CHART_COLOR_CHART_UP,clr))
     {
      //--- display the error message in Experts journal
      Print(__FUNCTION__+", Error Code = ",GetLastError());
      return(false);
     }
//--- successful execution
   return(true);
}- CHART COLOR_CHART_DOWN – 下降条形图的主体、阴影和边框的颜色。
//+------------------------------------------------------------------+
//| The function receives color of up bar, its shadow and            |
//| border of a bearish candlestick's body.                          |
//+------------------------------------------------------------------+
color ChartDownColorGet(const long chart_ID=0)
  {
//--- prepare the variable to receive the color
   long result=clrNONE;
//--- reset the error value
   ResetLastError();
//--- receive the color of down bar, its shadow and border of bearish candlestick's body
   if(!ChartGetInteger(chart_ID,CHART_COLOR_CHART_DOWN,0,result))
     {
      //--- display the error message in Experts journal
      Print(__FUNCTION__+", Error Code = ",GetLastError());
     }
//--- return the value of the chart property
   return((color)result);
  }
//+------------------------------------------------------------------+
//| The function sets color of down bar, its shadow and              |
//| border of a bearish candlestick's body.                          |
//+------------------------------------------------------------------+
bool ChartDownColorSet(const color clr,const long chart_ID=0)
  {
//--- reset the error value
   ResetLastError();
//--- set the color of down bar, its shadow and border of bearish candlestick's body
   if(!ChartSetInteger(chart_ID,CHART_COLOR_CHART_DOWN,clr))
     {
      //--- display the error message in Experts journal
      Print(__FUNCTION__+", Error Code = ",GetLastError());
      return(false);
     }
//--- successful execution
   return(true);
}- CHART COLOR_CHART_LINE – 图表线和Doji条形图的颜色。
//+------------------------------------------------------------------------+
//| The function receives color of the chart line and Doji candlesticks.   |
//+------------------------------------------------------------------------+
color ChartLineColorGet(const long chart_ID=0)
  {
//--- prepare the variable to receive the color
   long result=clrNONE;
//--- reset the error value
   ResetLastError();
//--- receive color of the chart line and Doji candlesticks
   if(!ChartGetInteger(chart_ID,CHART_COLOR_CHART_LINE,0,result))
     {
      //--- display the error message in Experts journal
      Print(__FUNCTION__+", Error Code = ",GetLastError());
     }
//--- return the value of the chart property
   return((color)result);
  }
//+------------------------------------------------------------------+
//| The function sets the color of the chart line and Doji           |
//| candlesticks.                                                    |
//+------------------------------------------------------------------+
bool ChartLineColorSet(const color clr,const long chart_ID=0)
  {
//--- reset the error value
   ResetLastError();
//--- set color of the chart line and Doji candlesticks
   if(!ChartSetInteger(chart_ID,CHART_COLOR_CHART_LINE,clr))
     {
      //--- display the error message in Experts journal
      Print(__FUNCTION__+", Error Code = ",GetLastError());
      return(false);
     }
//--- successful execution
   return(true);
}- CHART COLOR_CANDLE_BULL – 上升条形图主体的颜色。
//+------------------------------------------------------------------+
//| The function receives color of bullish candlestick's body.       |
//+------------------------------------------------------------------+
color ChartBullColorGet(const long chart_ID=0)
  {
//--- prepare the variable to receive the color
   long result=clrNONE;
//--- reset the error value
   ResetLastError();
//--- receive the color of bullish candlestick's body
   if(!ChartGetInteger(chart_ID,CHART_COLOR_CANDLE_BULL,0,result))
     {
      //--- display the error message in Experts journal
      Print(__FUNCTION__+", Error Code = ",GetLastError());
     }
//--- return the value of the chart property
   return((color)result);
  }
//+------------------------------------------------------------------+
//| The function sets color of bullish candlestick's body.           |
//+------------------------------------------------------------------+
bool ChartBullColorSet(const color clr,const long chart_ID=0)
  {
//--- reset the error value
   ResetLastError();
//--- set the color of bullish candlestick's body
   if(!ChartSetInteger(chart_ID,CHART_COLOR_CANDLE_BULL,clr))
     {
      //--- display the error message in Experts journal
      Print(__FUNCTION__+", Error Code = ",GetLastError());
      return(false);
     }
//--- successful execution
   return(true);
}- CHART COLOR_CANDLE_BEAR – 下降条形图主体的颜色。
//+------------------------------------------------------------------+
//| The function receives color of bearish candlestick's body.       |
//+------------------------------------------------------------------+
color ChartBearColorGet(const long chart_ID=0)
  {
//--- prepare the variable to receive the color
   long result=clrNONE;
//--- reset the error value
   ResetLastError();
//--- receive the color of bearish candlestick's body
   if(!ChartGetInteger(chart_ID,CHART_COLOR_CANDLE_BEAR,0,result))
     {
      //--- display the error message in Experts journal
      Print(__FUNCTION__+", Error Code = ",GetLastError());
     }
//--- return the value of the chart property
   return((color)result);
  }
//+------------------------------------------------------------------+
//| The function sets color of bearish candlestick's body.           |
//+------------------------------------------------------------------+
bool ChartBearColorSet(const color clr,const long chart_ID=0)
  {
//--- reset the error value
   ResetLastError();
//--- set the color of bearish candlestick's body
   if(!ChartSetInteger(chart_ID,CHART_COLOR_CANDLE_BEAR,clr))
     {
      //--- display the error message in Experts journal
      Print(__FUNCTION__+", Error Code = ",GetLastError());
      return(false);
     }
//--- successful execution
   return(true);
}- CHART COLOR_BID – Bid价格线的颜色。
//+------------------------------------------------------------------+
//| The function receives the color of Bid line.                     |
//+------------------------------------------------------------------+
color ChartBidColorGet(const long chart_ID=0)
  {
//--- prepare the variable to receive the color
   long result=clrNONE;
//--- reset the error value
   ResetLastError();
//--- receive the color of Bid price line
   if(!ChartGetInteger(chart_ID,CHART_COLOR_BID,0,result))
     {
      //--- display the error message in Experts journal
      Print(__FUNCTION__+", Error Code = ",GetLastError());
     }
//--- return the value of the chart property
   return((color)result);
  }
//+------------------------------------------------------------------+
//| The function sets the color of Bid line.                         |
//+------------------------------------------------------------------+
bool ChartBidColorSet(const color clr,const long chart_ID=0)
  {
//--- reset the error value
   ResetLastError();
//--- set the color of Bid price line
   if(!ChartSetInteger(chart_ID,CHART_COLOR_BID,clr))
     {
      //--- display the error message in Experts journal
      Print(__FUNCTION__+", Error Code = ",GetLastError());
      return(false);
     }
//--- successful execution
   return(true);
}- CHART COLOR_ASK – Ask价格线的颜色。
//+------------------------------------------------------------------+
//| The function receives the color of Ask line.                     |
//+------------------------------------------------------------------+
color ChartAskColorGet(const long chart_ID=0)
  {
//--- prepare the variable to receive the color
   long result=clrNONE;
//--- reset the error value
   ResetLastError();
//--- receive the color of Ask price line
   if(!ChartGetInteger(chart_ID,CHART_COLOR_ASK,0,result))
     {
      //--- display the error message in Experts journal
      Print(__FUNCTION__+", Error Code = ",GetLastError());
     }
//--- return the value of the chart property
   return((color)result);
  }
//+------------------------------------------------------------------+
//| The function sets the color of Ask line.                         |
//+------------------------------------------------------------------+
bool ChartAskColorSet(const color clr,const long chart_ID=0)
  {
//--- reset the error value
   ResetLastError();
//--- set the color of Ask price line
   if(!ChartSetInteger(chart_ID,CHART_COLOR_ASK,clr))
     {
      //--- display the error message in Experts journal
      Print(__FUNCTION__+", Error Code = ",GetLastError());
      return(false);
     }
//--- successful execution
   return(true);
}- CHART COLOR_LAST – 最后执行交易的价格线(Last)的颜色。
//+----------------------------------------------------------------------+
//| The function receives color of the last performed deal's price line. |
//+----------------------------------------------------------------------+
color ChartLastColorGet(const long chart_ID=0)
  {
//--- prepare the variable to receive the color
   long result=clrNONE;
//--- reset the error value
   ResetLastError();
//--- receive color of the last performed deal's price line (Last)
   if(!ChartGetInteger(chart_ID,CHART_COLOR_LAST,0,result))
     {
      //--- display the error message in Experts journal
      Print(__FUNCTION__+", Error Code = ",GetLastError());
     }
//--- return the value of the chart property
   return((color)result);
  }
//+------------------------------------------------------------------+
//| The function sets color of the last performed deal's price       |
//| line.                                                            |
//+------------------------------------------------------------------+
bool ChartLastColorSet(const color clr,const long chart_ID=0)
  {
//--- reset the error value
   ResetLastError();
//--- set color of the last performed deal's price line (Last)
   if(!ChartSetInteger(chart_ID,CHART_COLOR_LAST,clr))
     {
      //--- display the error message in Experts journal
      Print(__FUNCTION__+", Error Code = ",GetLastError());
      return(false);
     }
//--- successful execution
   return(true);
}- CHART COLOR_STOP_LEVEL – 止损和获利了结订单级别的颜色。
//+--------------------------------------------------------------------+
//| The function receives colors of Stop Loss and Take Profit levels.  |
//+--------------------------------------------------------------------+
color ChartStopLevelColorGet(const long chart_ID=0)
  {
//--- prepare the variable to receive the color
   long result=clrNONE;
//--- reset the error value
   ResetLastError();
//--- receive the color of stop order levels (Stop Loss and Take Profit)
   if(!ChartGetInteger(chart_ID,CHART_COLOR_STOP_LEVEL,0,result))
     {
      //--- display the error message in Experts journal
      Print(__FUNCTION__+", Error Code = ",GetLastError());
     }
//--- return the value of the chart property
   return((color)result);
  }
//+------------------------------------------------------------------+
//| The function sets Stop Loss and Take Profit level colors.        |
//+------------------------------------------------------------------+
bool ChartStopLevelColorSet(const color clr,const long chart_ID=0)
  {
//--- reset the error value
   ResetLastError();
//--- set the color of stop order levels (Stop Loss and Take Profit)
   if(!ChartSetInteger(chart_ID,CHART_COLOR_STOP_LEVEL,clr))
     {
      //--- display the error message in Experts journal
      Print(__FUNCTION__+", Error Code = ",GetLastError());
      return(false);
     }
//--- successful execution
   return(true);
}- CHART_SHOW_TRADE_LEVELS – 在图表上显示交易级别的属性(开放订单、止损、获利了结和待定订单的级别)。
//+---------------------------------------------------------------------+
//| The function defines if trading levels are displayed on the chart.  |
//+---------------------------------------------------------------------+
bool ChartShowTradeLevelsGet(bool &result,const long chart_ID=0)
  {
//--- prepare the variable to get the property value
   long value;
//--- reset the error value
   ResetLastError();
//--- receive the property value
   if(!ChartGetInteger(chart_ID,CHART_SHOW_TRADE_LEVELS,0,value))
     {
      //--- display the error message in Experts journal
      Print(__FUNCTION__+", Error Code = ",GetLastError());
      return(false);
     }
//--- store the value of the chart property in memory
   result=value;
//--- successful execution
   return(true);
  }
//+------------------------------------------------------------------+
//| The function enables/disables trading levels display mode.       |
//+------------------------------------------------------------------+
bool ChartShowTradeLevelsSet(const bool value,const long chart_ID=0)
  {
//--- reset the error value
   ResetLastError();
//--- set property value
   if(!ChartSetInteger(chart_ID,CHART_SHOW_TRADE_LEVELS,0,value))
     {
      //--- display the error message in Experts journal
      Print(__FUNCTION__+", Error Code = ",GetLastError());
      return(false);
     }
//--- successful execution
   return(true);
}- CHART_DRAG_TRADE_LEVELS – 使用鼠标在图表上拖动交易级别的功能属性。
//+---------------------------------------------------------------------------+
//| The function defines if dragging trading levels on a chart using mouse    |
//| is allowed.                                                               |
//+---------------------------------------------------------------------------+
bool ChartDragTradeLevelsGet(bool &result,const long chart_ID=0)
  {
//--- prepare the variable to get the property value
   long value;
//--- reset the error value
   ResetLastError();
//--- receive the property value
   if(!ChartGetInteger(chart_ID,CHART_DRAG_TRADE_LEVELS,0,value))
     {
      //--- display the error message in Experts journal
      Print(__FUNCTION__+", Error Code = ",GetLastError());
      return(false);
     }
//--- store the value of the chart property in memory
   result=value;
//--- successful execution
   return(true);
  }
//+------------------------------------------------------------------+
//| The function enables/disables the mode of dragging trade levels  |
//| on the chart using mouse.                                        |
//+------------------------------------------------------------------+
bool ChartDragTradeLevelsSet(const bool value,const long chart_ID=0)
  {
//--- reset the error value
   ResetLastError();
//--- set property value
   if(!ChartSetInteger(chart_ID,CHART_DRAG_TRADE_LEVELS,0,value))
     {
      //--- display the error message in Experts journal
      Print(__FUNCTION__+", Error Code = ",GetLastError());
      return(false);
     }
//--- successful execution
   return(true);
}- CHART_SHOW_DATE_SCALE – 在图表上显示时间尺度的属性。
//+--------------------------------------------------------------------+
//| The function defines if the time scale is displayed on the chart.  |
//+--------------------------------------------------------------------+
bool ChartShowDateScaleGet(bool &result,const long chart_ID=0)
  {
//--- prepare the variable to get the property value
   long value;
//--- reset the error value
   ResetLastError();
//--- receive the property value
   if(!ChartGetInteger(chart_ID,CHART_SHOW_DATE_SCALE,0,value))
     {
      //--- display the error message in Experts journal
      Print(__FUNCTION__+", Error Code = ",GetLastError());
      return(false);
     }
//--- store the value of the chart property in memory
   result=value;
//--- successful execution
   return(true);
  }
//+-----------------------------------------------------------------------------+
//| The function enables/disables the mode of displaying the time scale on a    |
//| chart.                                                                      |
//+-----------------------------------------------------------------------------+
bool ChartShowDateScaleSet(const bool value,const long chart_ID=0)
  {
//--- reset the error value
   ResetLastError();
//--- set property value
   if(!ChartSetInteger(chart_ID,CHART_SHOW_DATE_SCALE,0,value))
     {
      //--- display the error message in Experts journal
      Print(__FUNCTION__+", Error Code = ",GetLastError());
      return(false);
     }
//--- successful execution
   return(true);
}- CHART_SHOW_PRICE_SCALE – 在图表上显示价格尺度的属性。
//+--------------------------------------------------------------------+
//| The function defines if the price scale is displayed on the chart. |
//+--------------------------------------------------------------------+
bool ChartShowPriceScaleGet(bool &result,const long chart_ID=0)
  {
//--- prepare the variable to get the property value
   long value;
//--- reset the error value
   ResetLastError();
//--- receive the property value
   if(!ChartGetInteger(chart_ID,CHART_SHOW_PRICE_SCALE,0,value))
     {
      //--- display the error message in Experts journal
      Print(__FUNCTION__+", Error Code = ",GetLastError());
      return(false);
     }
//--- store the value of the chart property in memory
   result=value;
//--- successful execution
   return(true);
  }
//+----------------------------------------------------------------------------+
//| The function enables/disables the mode of displaying the price scale on a  |
//| chart.                                                                     |
//+----------------------------------------------------------------------------+
bool ChartShowPriceScaleSet(const bool value,const long chart_ID=0)
  {
//--- reset the error value
   ResetLastError();
//--- set property value
   if(!ChartSetInteger(chart_ID,CHART_SHOW_PRICE_SCALE,0,value))
     {
      //--- display the error message in Experts journal
      Print(__FUNCTION__+", Error Code = ",GetLastError());
      return(false);
     }
//--- successful execution
   return(true);
}- CHART_SHIFT_SIZE – 零条形图从右侧边缘移动的百分比大小。
//+---------------------------------------------------------------------------+
//| The function receives shift size of the zero bar from the right border    |
//| of the chart in percentage values (from 10% up to 50%).                   |
//+---------------------------------------------------------------------------+
double ChartShiftSizeGet(const long chart_ID=0)
  {
//--- prepare the variable to get the result
   double result=EMPTY_VALUE;
//--- reset the error value
   ResetLastError();
//--- receive the property value
   if(!ChartGetDouble(chart_ID,CHART_SHIFT_SIZE,0,result))
     {
      //--- display the error message in Experts journal
      Print(__FUNCTION__+", Error Code = ",GetLastError());
     }
//--- return the value of the chart property
   return(result);
  }
//+--------------------------------------------------------------------------------------+
//| The function sets the shift size of the zero bar from the right                      |
//| border of the chart in percentage values (from 10% up to 50%). To enable the shift   |
//| mode, CHART_SHIFT property value should be set to                                    |
//| true.                                                                                |
//+--------------------------------------------------------------------------------------+
bool ChartShiftSizeSet(const double value,const long chart_ID=0)
  {
//--- reset the error value
   ResetLastError();
//--- set property value
   if(!ChartSetDouble(chart_ID,CHART_SHIFT_SIZE,value))
     {
      //--- display the error message in Experts journal
      Print(__FUNCTION__+", Error Code = ",GetLastError());
      return(false);
     }
//--- successful execution
   return(true);
}- CHART_IS_OFFLINE – 检查图表的离线模式。
//+------------------------------------------------------------------+
//| The function checks offline mode of the chart                    |
//+------------------------------------------------------------------+
bool CheckChartOffline(const long chart_ID=0)
{
   bool offline=ChartGetInteger(chart_ID,CHART_IS_OFFLINE);
   return(offline);
}- CHART_FIXED_POSITION – 从左侧边缘开始的图表固定位置,以百分比值表示。
//+--------------------------------------------------------------------------+
//| The function receives the location of the chart fixed position from the  |
//| left border in percentage value.                                         |
//+--------------------------------------------------------------------------+
double ChartFixedPositionGet(const long chart_ID=0)
  {
//--- prepare the variable to get the result
   double result=EMPTY_VALUE;
//--- reset the error value
   ResetLastError();
//--- receive the property value
   if(!ChartGetDouble(chart_ID,CHART_FIXED_POSITION,0,result))
     {
      //--- display the error message in Experts journal
      Print(__FUNCTION__+", Error Code = ",GetLastError());
     }
//--- return the value of the chart property
   return(result);
  }
//+---------------------------------------------------------------------+
//| The function sets the location of the chart fixed position from the |
//| left border in percentage value. To view the location of the        |
//| chart fixed position, the value of                                  |
//| CHART_AUTOSCROLL property should be set to false.                   |
//+---------------------------------------------------------------------+
bool ChartFixedPositionSet(const double value,const long chart_ID=0)
  {
//--- reset the error value
   ResetLastError();
//--- set property value
   if(!ChartSetDouble(chart_ID,CHART_FIXED_POSITION,value))
     {
      //--- display the error message in Experts journal
      Print(__FUNCTION__+", Error Code = ",GetLastError());
      return(false);
     }
//--- successful execution
   return(true);
}- CHART_FIXED_MAX – 图表的固定最大值属性。
//+------------------------------------------------------------------+
//| The function receives the value of chart's fixed maximum.        |
//+------------------------------------------------------------------+
double ChartFixedMaxGet(const long chart_ID=0)
  {
//--- prepare the variable to get the result
   double result=EMPTY_VALUE;
//--- reset the error value
   ResetLastError();
//--- receive the property value
   if(!ChartGetDouble(chart_ID,CHART_FIXED_MAX,0,result))
     {
      //--- display the error message in Experts journal
      Print(__FUNCTION__+", Error Code = ",GetLastError());
     }
//--- return the value of the chart property
   return(result);
  }
//+------------------------------------------------------------------+
//| The function sets the value of chart's fixed maximum.            |
//| To change the value of the property,                             |
//| CHART_SCALEFIX property value should be preliminarily set to     |
//| true.                                                            |
//+------------------------------------------------------------------+
bool ChartFixedMaxSet(const double value,const long chart_ID=0)
  {
//--- reset the error value
   ResetLastError();
//--- set property value
   if(!ChartSetDouble(chart_ID,CHART_FIXED_MAX,value))
     {
      //--- display the error message in Experts journal
      Print(__FUNCTION__+", Error Code = ",GetLastError());
      return(false);
     }
//--- successful execution
   return(true);
}- CHART_FIXED_MIN – 图表的固定最小值属性。
//+------------------------------------------------------------------+
//| The function receives the value of chart's fixed minimum.        |
//+------------------------------------------------------------------+
double ChartFixedMinGet(const long chart_ID=0)
  {
//--- prepare the variable to get the result
   double result=EMPTY_VALUE;
//--- reset the error value
   ResetLastError();
//--- receive the property value
   if(!ChartGetDouble(chart_ID,CHART_FIXED_MIN,0,result))
     {
      //--- display the error message in Experts journal
      Print(__FUNCTION__+", Error Code = ",GetLastError());
     }
//--- return the value of the chart property
   return(result);
  }
//+------------------------------------------------------------------+
//| The function sets the value of chart's fixed minimum.            |
//| To change the value of the property,                             |
//| CHART_SCALEFIX property value should be preliminarily set to     |
//| true.                                                            |
//+------------------------------------------------------------------+
bool ChartFixedMinSet(const double value,const long chart_ID=0)
  {
//--- reset the error value
   ResetLastError();
//--- set property value
   if(!ChartSetDouble(chart_ID,CHART_FIXED_MIN,value))
     {
      //--- display the error message in Experts journal
      Print(__FUNCTION__+", Error Code = ",GetLastError());
      return(false);
     }
//--- successful execution
   return(true);
}- CHART_POINTS_PER_BAR – 每条形图的比例值。
//+---------------------------------------------------------------------------+
//| The function receives the value of the chart scale in points per bar.     |
//+---------------------------------------------------------------------------+
double ChartPointsPerBarGet(const long chart_ID=0)
  {
//--- prepare the variable to get the result
   double result=EMPTY_VALUE;
//--- reset the error value
   ResetLastError();
//--- receive the property value
   if(!ChartGetDouble(chart_ID,CHART_POINTS_PER_BAR,0,result))
     {
      //--- display the error message in Experts journal
      Print(__FUNCTION__+", Error Code = ",GetLastError());
     }
//--- return the value of the chart property
   return(result);
  }
//+----------------------------------------------------------------------+
//| The function sets the value of the chart scale in points per bar.    |
//| To view the result of this property's value change,                  |
//| the value of                                                         |
//| CHART_SCALE_PT_PER_BAR property should be preliminarily set to true. |
//+----------------------------------------------------------------------+
bool ChartPointsPerBarSet(const double value,const long chart_ID=0)
  {
//--- reset the error value
   ResetLastError();
//--- set property value
   if(!ChartSetDouble(chart_ID,CHART_POINTS_PER_BAR,value))
     {
      //--- display the error message in Experts journal
      Print(__FUNCTION__+", Error Code = ",GetLastError());
      return(false);
     }
//--- successful execution
   return(true);
}- CHART_PRICE_MIN 返回图表的最小值。
//+---------------------------------------------------------------------------------+
//| The function receives the value of the chart minimum in the main window or a    |
//| subwindow.                                                                      |
//+---------------------------------------------------------------------------------+
double ChartPriceMin(const long chart_ID=0,const int sub_window=0)
  {
//--- prepare the variable to get the result
   double result=EMPTY_VALUE;
//--- reset the error value
   ResetLastError();
//--- receive the property value
   if(!ChartGetDouble(chart_ID,CHART_PRICE_MIN,sub_window,result))
     {
      //--- display the error message in Experts journal
      Print(__FUNCTION__+", Error Code = ",GetLastError());
     }
//--- return the value of the chart property
   return(result);
}- CHART_PRICE_MAX 返回图表的最大值。
//+--------------------------------------------------------------------------------+
//| The function receives the value of the chart maximum in the main window or a   |
//| subwindow.                                                                     |
//+--------------------------------------------------------------------------------+
double ChartPriceMax(const long chart_ID=0,const int sub_window=0)
  {
//--- prepare the variable to get the result
   double result=EMPTY_VALUE;
//--- reset the error value
   ResetLastError();
//--- receive the property value
   if(!ChartGetDouble(chart_ID,CHART_PRICE_MAX,sub_window,result))
     {
      //--- display the error message in Experts journal
      Print(__FUNCTION__+", Error Code = ",GetLastError());
     }
//--- return the value of the chart property
   return(result);
}- CHART_COMMENT – 图表的注释。
//+----------------------------------------------------------------------+
//| The function receives comment in the upper left corner of the chart. |
//+----------------------------------------------------------------------+
bool ChartCommentGet(string &result,const long chart_ID=0)
  {
//--- reset the error value
   ResetLastError();
//--- receive the property value
   if(!ChartGetString(chart_ID,CHART_COMMENT,result))
     {
      //--- display the error message in Experts journal
      Print(__FUNCTION__+", Error Code = ",GetLastError());
      return(false);
     }
//--- successful execution
   return(true);
  }
//+------------------------------------------------------------------+
//| The function sets comment in the upper left corner of the        |
//| chart.                                                           |
//+------------------------------------------------------------------+
bool ChartCommentSet(const string str,const long chart_ID=0)
  {
//--- reset the error value
   ResetLastError();
//--- set property value
   if(!ChartSetString(chart_ID,CHART_COMMENT,str))
     {
      //--- display the error message in Experts journal
      Print(__FUNCTION__+", Error Code = ",GetLastError());
      return(false);
     }
//--- successful execution
   return(true);
  }
图表属性面板
//--- connect the library of control elements
#include <ChartObjects\ChartObjectsTxtControls.mqh>
//--- predefined constants
#define X_PROPERTY_NAME_1 10 // х coordinate of the property name in the first column
#define X_PROPERTY_VALUE_1 225 // х coordinate of the property value in the first column
#define X_PROPERTY_NAME_2 345 // х coordinate of the property name in the second and third columns
#define X_PROPERTY_VALUE_2 550 // х coordinate of the property value in the second and third columns
#define X_BUTTON_1 285 // х coordinate of the button in the first column
#define X_BUTTON_2 700 // х coordinate of the button in the second column
#define Y_PROPERTY_1 30 // y coordinate of the beginning of the first and second column
#define Y_PROPERTY_2 286 // y coordinate of the beginning of the third column
#define Y_DISTANCE 16 // y axial distance between the lines
#define LAST_PROPERTY_NUMBER 111 // number of the last graphical property
//--- input parameters
input color InpFirstColor=clrDodgerBlue; // Color of odd lines
input color InpSecondColor=clrGoldenrod; // Color of even lines
//--- variables and arrays
CChartObjectLabel ExtLabelsName[]; // labels for displaying property names
CChartObjectLabel ExtLabelsValue[]; // labels for displaying property values
CChartObjectButton ExtButtons[]; // buttons
int ExtNumbers[]; // property indices
string ExtNames[]; // property names
uchar ExtDataTypes[]; // property data types (integer, double, string)
uint ExtGroupTypes[]; // array that stores the data on belonging of properties to one of the groups
uchar ExtDrawTypes[]; // array that stores the data on the type of property display
double ExtMaxValue[]; // maximum property values that are possible when working with the panel
double ExtMinValue[]; // minimum property values that are possible when working with the panel
double ExtStep[]; // steps for changing properties
int ExtCount; // total number of all properties
color ExtColors[2]; // array of colors for displaying lines
string ExtComments[2]; // array of comments (for CHART_COMMENT property)
//+------------------------------------------------------------------+
//| Custom indicator initialization function |
//+------------------------------------------------------------------+
int OnInit()
{
//--- display a comment on the chart
Comment("SomeComment");
//--- store colors in the array to be able to switch between them later
ExtColors[0]=InpFirstColor;
ExtColors[1]=InpSecondColor;
//--- store comments in the array to be able to switch between them later
ExtComments[0]="FirstComment";
ExtComments[1]="SecondComment";
//--- prepare and display the control panel for managing chart properties
if(!PrepareControls())
return(INIT_FAILED);
//--- successful execution
return(INIT_SUCCEEDED);
}
//+------------------------------------------------------------------+
//| Deinitialization function of the expert |
//+------------------------------------------------------------------+
void OnDeinit(const int reason)
{
//--- remove the comment on the chart
Comment("");
}
//+------------------------------------------------------------------+
//| Handler of a chart event |
//+------------------------------------------------------------------+
void OnChartEvent(const int id,
const long &lparam,
const double &dparam,
const string &sparam)
{
//--- check the event of clicking the chart object
if(id==CHARTEVENT_OBJECT_CLICK)
{
//--- divide the object name by separator
string obj_name[];
StringSplit(sparam,'_',obj_name);
//--- check if the object is a button
if(obj_name[0]=="Button")
{
//--- receive button index
int index=(int)StringToInteger(obj_name[1]);
//--- unpress the button
ExtButtons[index].State(false);
//--- set the new value of the property depending on its type
if(ExtDataTypes[index]=='I')
ChangeIntegerProperty(index);
if(ExtDataTypes[index]=='D')
ChangeDoubleProperty(index);
if(ExtDataTypes[index]=='S')
ChangeStringProperty(index);
}
}
//--- re-draw property values
RedrawProperties();
ChartRedraw();
}
//+------------------------------------------------------------------+
//| Change the integer property of the chart |
//+------------------------------------------------------------------+
void ChangeIntegerProperty(const int index)
{
//--- receive the current property value
long value=ChartGetInteger(0,(ENUM_CHART_PROPERTY_INTEGER)ExtNumbers[index]);
//--- define the following property value
switch(ExtDrawTypes[index])
{
case 'C':
value=GetNextColor((color)value);
break;
default:
value=(long)GetNextValue((double)value,index);
break;
}
//--- set the new property value
ChartSetInteger(0,(ENUM_CHART_PROPERTY_INTEGER)ExtNumbers[index],0,value);
}
//+------------------------------------------------------------------+
//| Change double property of the chart |
//+------------------------------------------------------------------+
void ChangeDoubleProperty(const int index)
{
//--- receive the current property value
double value=ChartGetDouble(0,(ENUM_CHART_PROPERTY_DOUBLE)ExtNumbers[index]);
//--- define the following property value
value=GetNextValue(value,index);
//--- set the new property value
ChartSetDouble(0,(ENUM_CHART_PROPERTY_DOUBLE)ExtNumbers[index],value);
}
//+------------------------------------------------------------------+
//| Change string property of the chart |
//+------------------------------------------------------------------+
void ChangeStringProperty(const int index)
{
//--- static variable for switching inside ExtComments array
static uint comment_index=1;
//--- change index for receiving another comment
comment_index=1-comment_index;
//--- set the new property value
ChartSetString(0,(ENUM_CHART_PROPERTY_STRING)ExtNumbers[index],ExtComments[comment_index]);
}
//+------------------------------------------------------------------+
//| Define the next property value |
//+------------------------------------------------------------------+
double GetNextValue(const double value,const int index)
{
if(value+ExtStep[index]<=ExtMaxValue[index])
return(value+ExtStep[index]);
else
return(ExtMinValue[index]);
}
//+------------------------------------------------------------------+
//| Receive the next color for color type property |
//+------------------------------------------------------------------+
color GetNextColor(const color clr)
{
//--- return the following color value
switch(clr)
{
case clrWhite: return(clrRed);
case clrRed: return(clrGreen);
case clrGreen: return(clrBlue);
case clrBlue: return(clrBlack);
default: return(clrWhite);
}
}
//+------------------------------------------------------------------+
//| Re-draw property values |
//+------------------------------------------------------------------+
void RedrawProperties(void)
{
//--- property value text
string text;
long value;
//--- loop of the number of properties
for(int i=0;i<ExtCount;i++)
{
text="";
switch(ExtDataTypes[i])
{
case 'I':
//--- receive the current property value
if(!ChartGetInteger(0,(ENUM_CHART_PROPERTY_INTEGER)ExtNumbers[i],0,value))
break;
//--- integer property text
switch(ExtDrawTypes[i])
{
//--- color property
case 'C':
text=(string)((color)value);
break;
//--- boolean property
case 'B':
text=(string)((bool)value);
break;
//--- ENUM_CHART_MODE enumeration property
case 'M':
text=EnumToString((ENUM_CHART_MODE)value);
break;
//--- ENUM_CHART_VOLUME_MODE enumeration property
case 'V':
text=EnumToString((ENUM_CHART_VOLUME_MODE)value);
break;
//--- int type number
default:
text=IntegerToString(value);
break;
}
break;
case 'D':
//--- double property text
text=DoubleToString(ChartGetDouble(0,(ENUM_CHART_PROPERTY_DOUBLE)ExtNumbers[i]),4);
break;
case 'S':
//--- string property text
text=ChartGetString(0,(ENUM_CHART_PROPERTY_STRING)ExtNumbers[i]);
break;
}
//--- display property value
ExtLabelsValue[i].Description(text);
}
}
//+------------------------------------------------------------------+
//| Create the panel for managing chart properties |
//+------------------------------------------------------------------+
bool PrepareControls(void)
{
//--- allocate memory for arrays with a reserve
MemoryAllocation(LAST_PROPERTY_NUMBER+1);
//--- variables
int i=0; // loop variable
int col_1=0; // number of properties in the first column
int col_2=0; // number of properties in the second column
int col_3=0; // number of properties in the third column
//--- current number of properties - 0
ExtCount=0;
//--- looking for properties in the loop
while(i<=LAST_PROPERTY_NUMBER)
{
//--- store the current number of the property
ExtNumbers[ExtCount]=i;
//--- increase the value of the loop variable
i++;
//--- check if there is a property with such a number
if(CheckNumber(ExtNumbers[ExtCount],ExtNames[ExtCount],ExtDataTypes[ExtCount],ExtGroupTypes[ExtCount],ExtDrawTypes[ExtCount]))
{
//--- create control elements for the property
switch(ExtGroupTypes[ExtCount])
{
case 1:
//--- create labels and a button for the property
if(!ShowProperty(ExtCount,0,X_PROPERTY_NAME_1,X_PROPERTY_VALUE_1,X_BUTTON_1,Y_PROPERTY_1+col_1*Y_DISTANCE,true))
return(false);
//--- number of the elements in the first column has increased
col_1++;
break;
case 2:
//--- create labels and a button for the property
if(!ShowProperty(ExtCount,1,X_PROPERTY_NAME_2,X_PROPERTY_VALUE_2,X_BUTTON_2,Y_PROPERTY_1+col_2*Y_DISTANCE,true))
return(false);
//--- number of the elements in the second column has increased
col_2++;
break;
case 3:
//--- create only labels for the property
if(!ShowProperty(ExtCount,2,X_PROPERTY_NAME_2,X_PROPERTY_VALUE_2,0,Y_PROPERTY_2+col_3*Y_DISTANCE,false))
return(false);
//--- number of the elements in the third column has increased
col_3++;
break;
}
//--- define maximum and minimum property value and step
GetMaxMinStep(ExtNumbers[ExtCount],ExtMaxValue[ExtCount],ExtMinValue[ExtCount],ExtStep[ExtCount]);
//--- increase the number of properties
ExtCount++;
}
}
//--- free the memory not used by arrays
MemoryAllocation(ExtCount);
//--- re-draw property values
RedrawProperties();
ChartRedraw();
//--- successful execution
return(true);
}
//+------------------------------------------------------------------+
//| Allocate memory for arrays |
//+------------------------------------------------------------------+
void MemoryAllocation(const int size)
{
ArrayResize(ExtLabelsName,size);
ArrayResize(ExtLabelsValue,size);
ArrayResize(ExtButtons,size);
ArrayResize(ExtNumbers,size);
ArrayResize(ExtNames,size);
ArrayResize(ExtDataTypes,size);
ArrayResize(ExtGroupTypes,size);
ArrayResize(ExtDrawTypes,size);
ArrayResize(ExtMaxValue,size);
ArrayResize(ExtMinValue,size);
ArrayResize(ExtStep,size);
}
//+------------------------------------------------------------------+
//| Check if the property index belongs to the one of |
//| ENUM_CHART_PROPERTIES enumerations |
//+------------------------------------------------------------------+
bool CheckNumber(const int ind,string &name,uchar &data_type,uint &group_type,uchar &draw_type)
{
//--- check if the property is of integer type
ResetLastError();
name=EnumToString((ENUM_CHART_PROPERTY_INTEGER)ind);
if(_LastError==0)
{
data_type='I'; // property from ENUM_CHART_PROPERTY_INTEGER enumeration
GetTypes(ind,group_type,draw_type); // define property display parameters
return(true);
}
//--- check if the property is of double type
ResetLastError();
name=EnumToString((ENUM_CHART_PROPERTY_DOUBLE)ind);
if(_LastError==0)
{
data_type='D'; // property from ENUM_CHART_PROPERTY_DOUBLE enumeration
GetTypes(ind,group_type,draw_type); // define property display parameters
return(true);
}
//--- check if the property is of string type
ResetLastError();
name=EnumToString((ENUM_CHART_PROPERTY_STRING)ind);
if(_LastError==0)
{
data_type='S'; // property from ENUM_CHART_PROPERTY_STRING enumeration
GetTypes(ind,group_type,draw_type); // define property display parameters
return(true);
}
//--- property does not belong to any enumeration
return(false);
}
//+------------------------------------------------------------------+
//| Define the group the property should be stored in, |
//| as well as its display type |
//+------------------------------------------------------------------+
void GetTypes(const int property_number,uint &group_type,uchar &draw_type)
{
//--- check if the property belongs to the third group
//--- third group properties are displayed in the second column starting from CHART_BRING_TO_TOP
if(CheckThirdGroup(property_number,group_type,draw_type))
return;
//--- check if the property belongs to the second group
//--- second group properties are displayed at the beginning of the second column
if(CheckSecondGroup(property_number,group_type,draw_type))
return;
//--- if you find yourself here, the property belongs to the first group (first column)
CheckFirstGroup(property_number,group_type,draw_type);
}
//+----------------------------------------------------------------------+
//| The function checks if the property belongs to the third group and |
//| defines its display type in case of a positive answer |
//+----------------------------------------------------------------------+
bool CheckThirdGroup(const int property_number,uint &group_type,uchar &draw_type)
{
//--- check if the property belongs to the third group
switch(property_number)
{
//--- boolean properties
case CHART_WINDOW_IS_VISIBLE:
draw_type='B';
break;
//--- integer properties
case CHART_VISIBLE_BARS:
case CHART_WINDOWS_TOTAL:
case CHART_WINDOW_HANDLE:
case CHART_WINDOW_YDISTANCE:
case CHART_FIRST_VISIBLE_BAR:
case CHART_WIDTH_IN_BARS:
case CHART_WIDTH_IN_PIXELS:
draw_type='I';
break;
//--- double properties
case CHART_PRICE_MIN:
case CHART_PRICE_MAX:
draw_type='D';
break;
//--- in fact, this property is a command of displaying the chart on top of all the others
//--- there is no need to apply this panel, as the window will always be
//--- on top of other ones before we use it
case CHART_BRING_TO_TOP:
draw_type=' ';
break;
//--- property does not belong to the third group
default:
return(false);
}
//--- property belongs to the third group
group_type=3;
return(true);
}
//+----------------------------------------------------------------------+
//| The function checks if the property belongs to the second group and |
//| defines its display type in case of a positive answer |
//+----------------------------------------------------------------------+
bool CheckSecondGroup(const int property_number,uint &group_type,uchar &draw_type)
{
//--- check if the property belongs to the second group
switch(property_number)
{
//--- ENUM_CHART_MODE type property
case CHART_MODE:
draw_type='M';
break;
//--- ENUM_CHART_VOLUME_MODE type property
case CHART_SHOW_VOLUMES:
draw_type='V';
break;
//--- string property
case CHART_COMMENT:
draw_type='S';
break;
//--- color property
case CHART_COLOR_BACKGROUND:
case CHART_COLOR_FOREGROUND:
case CHART_COLOR_GRID:
case CHART_COLOR_VOLUME:
case CHART_COLOR_CHART_UP:
case CHART_COLOR_CHART_DOWN:
case CHART_COLOR_CHART_LINE:
case CHART_COLOR_CANDLE_BULL:
case CHART_COLOR_CANDLE_BEAR:
case CHART_COLOR_BID:
case CHART_COLOR_ASK:
case CHART_COLOR_LAST:
case CHART_COLOR_STOP_LEVEL:
draw_type='C';
break;
//--- property does not belong to the second group
default:
return(false);
}
//--- property belongs to the second group
group_type=2;
return(true);
}
//+-----------------------------------------------------------------------+
//| This function is called only if it is already known that |
//| the property does not belong to the second and third property groups |
//+-----------------------------------------------------------------------+
void CheckFirstGroup(const int property_number,uint &group_type,uchar &draw_type)
{
//--- the property belongs to the first group
group_type=1;
//--- define property display type
switch(property_number)
{
//--- integer properties
case CHART_SCALE:
case CHART_HEIGHT_IN_PIXELS:
draw_type='I';
return;
//--- double properties
case CHART_SHIFT_SIZE:
case CHART_FIXED_POSITION:
case CHART_FIXED_MAX:
case CHART_FIXED_MIN:
case CHART_POINTS_PER_BAR:
draw_type='D';
return;
//--- only boolean properties have remained
default:
draw_type='B';
return;
}
}
//+------------------------------------------------------------------+
//| Create a label and a button for the property |
//+------------------------------------------------------------------+
bool ShowProperty(const int ind,const int type,const int x1,const int x2,
const int xb,const int y,const bool btn)
{
//--- static array for switching inside ExtColors color array
static uint color_index[3]={1,1,1};
//--- change index for receiving another color
color_index[type]=1-color_index[type];
//--- display labels and a button (if btn=true) for the property
if(!LabelCreate(ExtLabelsName[ind],"name_"+(string)ind,ExtNames[ind],ExtColors[color_index[type]],x1,y))
return(false);
if(!LabelCreate(ExtLabelsValue[ind],"value_"+(string)ind,"",ExtColors[color_index[type]],x2,y))
return(false);
if(btn && !ButtonCreate(ExtButtons[ind],(string)ind,xb,y+1))
return(false);
//--- successful execution
return(true);
}
//+------------------------------------------------------------------+
//| Create a label |
//+------------------------------------------------------------------+
bool LabelCreate(CChartObjectLabel &lbl,const string name,const string text,
const color clr,const int x,const int y)
{
if(!lbl.Create(0,"Label_"+name,0,x,y)) return(false);
if(!lbl.Description(text)) return(false);
if(!lbl.FontSize(10)) return(false);
if(!lbl.Color(clr)) return(false);
//--- successful execution
return(true);
}
//+------------------------------------------------------------------+
//| Create the button |
//+------------------------------------------------------------------+
bool ButtonCreate(CChartObjectButton &btn,const string name,
const int x,const int y)
{
if(!btn.Create(0,"Button_"+name,0,x,y,50,15)) return(false);
if(!btn.Description("Next")) return(false);
if(!btn.FontSize(10)) return(false);
if(!btn.Color(clrBlack)) return(false);
if(!btn.BackColor(clrWhite)) return(false);
if(!btn.BorderColor(clrBlack)) return(false);
//--- successful execution
return(true);
}
//+------------------------------------------------------------------+
//| Define maximum and minimum property value and step |
//+------------------------------------------------------------------+
void GetMaxMinStep(const int property_number,double &max,double &min,double &step)
{
double value;
//--- set values depending on the property type
switch(property_number)
{
case CHART_SCALE:
max=5;
min=0;
step=1;
break;
case CHART_MODE:
case CHART_SHOW_VOLUMES:
max=2;
min=0;
step=1;
break;
case CHART_SHIFT_SIZE:
max=50;
min=10;
step=2.5;
break;
case CHART_FIXED_POSITION:
max=90;
min=0;
step=15;
break;
case CHART_POINTS_PER_BAR:
max=19;
min=1;
step=3;
break;
case CHART_FIXED_MAX:
value=ChartGetDouble(0,CHART_FIXED_MAX);
max=value*1.25;
min=value;
step=value/32;
break;
case CHART_FIXED_MIN:
value=ChartGetDouble(0,CHART_FIXED_MIN);
max=value;
min=value*0.75;
step=value/32;
break;
case CHART_HEIGHT_IN_PIXELS:
max=700;
min=520;
step=30;
break;
//--- default values
default:
max=1;
min=0;
step=1;
}
}最后更新于