Signals of the Oscillator Relative Strength Index
Signals of the Oscillator Relative Strength Index
Signals of the Oscillator Relative Strength Index
This module of signals is based on the market models of the oscillator Relative Strength Index. The mechanism of making trade decisions based on signals obtained from the modules is described in a separate section.
Conditions of Generation of Signals
Below you can find the description of conditions when the module passes a signal to an Expert Advisor.
| Signal Type | Description of Conditions |
|---|---|
| For buying | - Reverse behind the oversold level — the oscillator turned upwards and its value at the analyzed bar is behind the oversold level (default value is 30).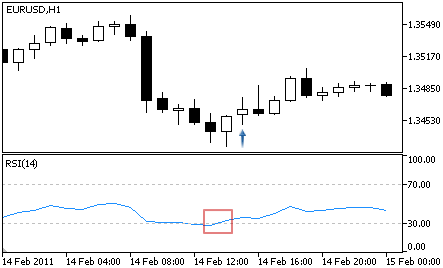 - Failed swing — the oscillator rises higher than the previous peak at the analyzed bar. 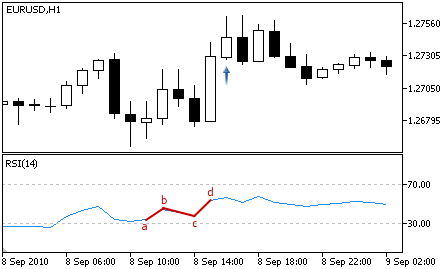 - Divergence — the first analyzed bottom of the oscillator is lower than the previous one, and the corresponding price bottom is lower than the previous one. 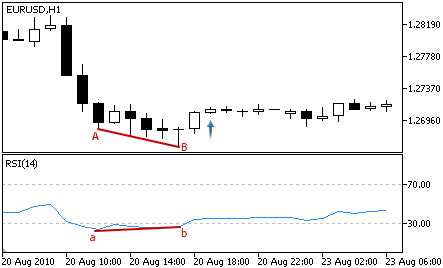 - Double divergence — the oscillator form three consequent bottoms, each of them is higher than the previous one; and the price formed three corresponding bottoms, and each of them is lower than the previous one. 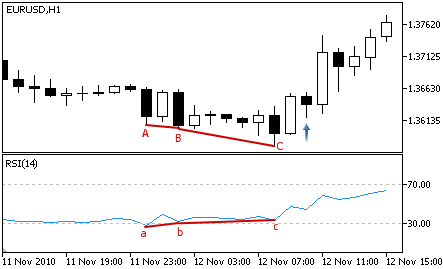 - Head/Shoulders — the oscillator formed three consequent bottoms, and the mid one is lower than the others. 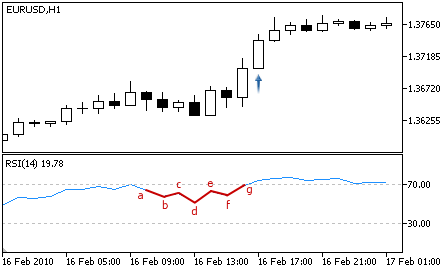 |
| For selling | - Reverse behind the overbought level — the oscillator turned downwards and its value at the analyzed bar is behind the overbought level (default value is 70).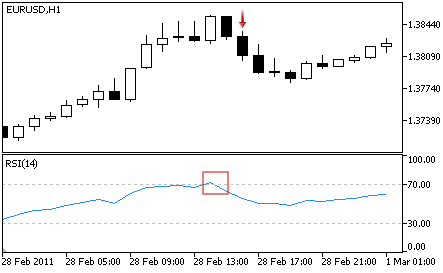 - Failed swing — the oscillator falls lower than the previous bottom at the analyzed bar. 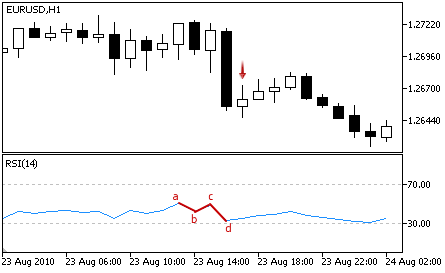 - Divergence — the first analyzed peak of the oscillator is lower than the previous one, and the corresponding price peak is higher than the previous peak. 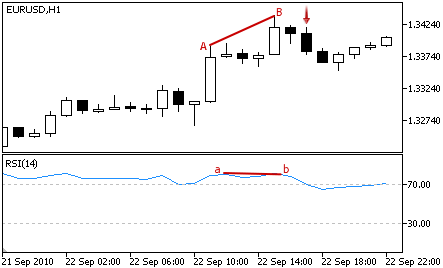 - Double divergence — the oscillator formed three consequent peaks, each of them is lower than the previous one; and the price formed three corresponding peaks, each of them is higher than the previous one. 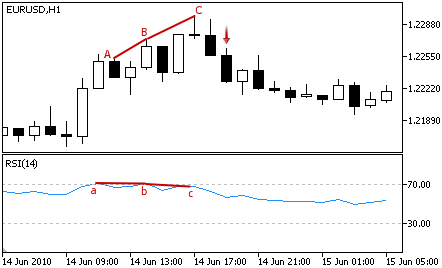 - Head/Shoulders — the oscillator formed three consequent peaks, and the mid one is higher than the others. 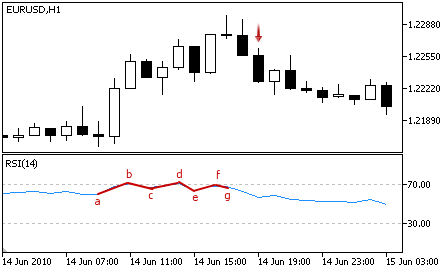 |
| No objections to buying | Value of the oscillator grows at the analyzed bar. |
| No objections to selling | Value of the oscillator falls at the analyzed bar. |
Note
Depending on the mode of operation of an Expert Advisor (“Every tick” or “Open prices only”) an analyzed bar is either the current bar (with index 0), or the last formed bar (with index 1).
Adjustable Parameters
This module has the following adjustable parameters:
| Parameter | Description |
|---|---|
| Weight | Weight of signal of the module in the interval 0 to 1. |
| PeriodRSI | Period of calculation of the oscillator. |
| Applied | A price series used for calculation of the oscillator. |
Last updated on