T-distribution
t-distribution
This section contains functions for working with Student’s t-distribution. They allow to calculate density, probability, quantiles and to generate pseudo-random numbers distributed according to the Student’s law. The t-distribution is defined by the following formula:
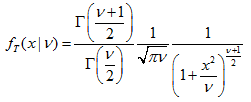
where:
- x — value of the random variable
- ν — parameter of distribution (number of degrees of freedom)
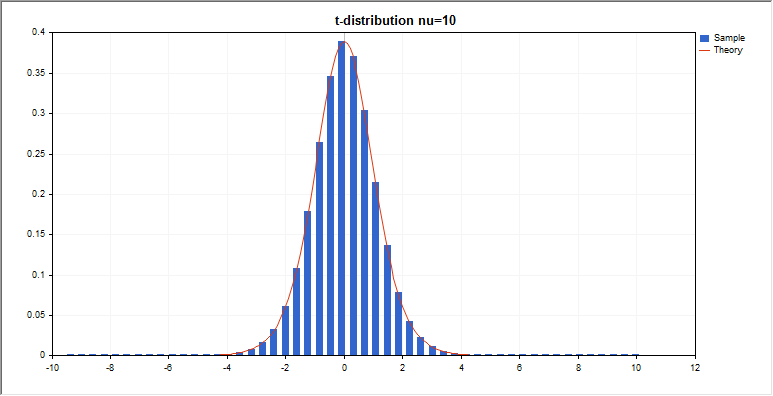
In addition to the calculation of the individual random variables, the library also implements the ability to work with arrays of random variables.
| Function | Description |
|---|---|
| MathProbabilityDensityT | Calculates the probability density function of the t-distribution |
| MathCumulativeDistributionT | Calculates the value of the t-distribution function |
| MathQuantileT | Calculates the value of the inverse t-distribution function for the specified probability |
| MathRandomT | Generates a pseudorandom variable/array of pseudorandom variables distributed according to the law of Student’s t-distribution |
| MathMomentsT | Calculates the theoretical numerical values of the first 4 moments of the Student’s t-distribution |
Example:
#include <Graphics\Graphic.mqh>
#include <Math\Stat\T.mqh>
#include <Math\Stat\Math.mqh>
#property script_show_inputs
//--- input parameters
input double nu_par=10;    // the number of degrees of freedom
//+------------------------------------------------------------------+
//| Script program start function                                    |
//+------------------------------------------------------------------+
void OnStart()
  {
//--- hide the price chart
   ChartSetInteger(0,CHART_SHOW,false);
//--- initialize the random number generator
   MathSrand(GetTickCount());
//--- generate a sample of the random variable
   long chart=0;
   string name="GraphicNormal";
   int n=1000000;       // the number of values in the sample
   int ncells=51;       // the number of intervals in the histogram
   double x[];          // centers of the histogram intervals
   double y[];          // the number of values from the sample falling within the interval
   double data[];       // sample of random values
   double max,min;      // the maximum and minimum values in the sample
//--- obtain a sample from the Student's t-distribution
   MathRandomT(nu_par,n,data);
//--- calculate the data to plot the histogram
   CalculateHistogramArray(data,x,y,max,min,ncells);
//--- obtain the sequence boundaries and the step for plotting the theoretical curve
   double step;
   GetMaxMinStepValues(max,min,step);
   step=MathMin(step,(max-min)/ncells);
//--- obtain the theoretically calculated data at the interval of [min,max]
   double x2[];
   double y2[];
   MathSequence(min,max,step,x2);
   MathProbabilityDensityT(x2,nu_par,false,y2);
//--- set the scale
   double theor_max=y2[ArrayMaximum(y2)];
   double sample_max=y[ArrayMaximum(y)];
   double k=sample_max/theor_max;
   for(int i=0; i<ncells; i++)
      y[i]/=k;
//--- output charts
   CGraphic graphic;
   if(ObjectFind(chart,name)<0)
      graphic.Create(chart,name,0,0,0,780,380);
   else
      graphic.Attach(chart,name);
   graphic.BackgroundMain(StringFormat("t-distribution nu=%G",nu_par));
   graphic.BackgroundMainSize(16);
//--- plot all curves
   graphic.CurveAdd(x,y,CURVE_HISTOGRAM,"Sample").HistogramWidth(6);
//--- and now plot the theoretical curve of the distribution density
   graphic.CurveAdd(x2,y2,CURVE_LINES,"Theory");
   graphic.CurvePlotAll();
//--- plot all curves
   graphic.Update();
  }
//+------------------------------------------------------------------+
//|  Calculate frequencies for data set                              |
//+------------------------------------------------------------------+
bool CalculateHistogramArray(const double &data[],double &intervals[],double &frequency[],
                             double &maxv,double &minv,const int cells=10)
  {
   if(cells<=1) return (false);
   int size=ArraySize(data);
   if(size<cells*10) return (false);
   minv=data[ArrayMinimum(data)];
   maxv=data[ArrayMaximum(data)];
   double range=maxv-minv;
   double width=range/cells;
   if(width==0) return false;
   ArrayResize(intervals,cells);
   ArrayResize(frequency,cells);
//--- define the interval centers
   for(int i=0; i<cells; i++)
     {
      intervals[i]=minv+(i+0.5)*width;
      frequency[i]=0;
     }
//--- fill the frequencies of falling within the interval
   for(int i=0; i<size; i++)
     {
      int ind=int((data[i]-minv)/width);
      if(ind>=cells) ind=cells-1;
      frequency[ind]++;
     }
   return (true);
  }
//+------------------------------------------------------------------+
//|  Calculates values for sequence generation                       |
//+------------------------------------------------------------------+
void GetMaxMinStepValues(double &maxv,double &minv,double &stepv)
  {
//--- calculate the absolute range of the sequence to obtain the precision of normalization
   double range=MathAbs(maxv-minv);
   int degree=(int)MathRound(MathLog10(range));
//--- normalize the maximum and minimum values to the specified precision
   maxv=NormalizeDouble(maxv,degree);
   minv=NormalizeDouble(minv,degree);
//--- sequence generation step is also set based on the specified precision
   stepv=NormalizeDouble(MathPow(10,-degree),degree);
   if((maxv-minv)/stepv<10)
      stepv/=10.;
  }
Last updated on