MathArcsinh
MathArcsinh
Returns the hyperbolic arcsine.
double MathArcsinh(
double value // -∞ < value < +∞
);Parameters
- val
[in] The value, the hyperbolic arcsine of which is to be calculated.
Return Value
The hyperbolic arcsine of the number.
Note
Instead of the MathArcsinh() function you can use the asinh() function.
Example:
#define GRAPH_WIDTH  750
#define GRAPH_HEIGHT 350

#include <Graphics\Graphic.mqh>

CGraphic ExtGraph;
//+------------------------------------------------------------------+
//| Script program start function                                    |
//+------------------------------------------------------------------+
void OnStart()
  {
   vector delta=vector::Full(101,2*M_PI/10);
   delta[0]=-31;
//--- get 101 values from -31 to 2 pi with delta step
   vector X=delta.CumSum();
//--- calculate the hyperbolic arc sine value for each value of the X vector
   vector Y=MathArcsinh(X);

//--- transfer the calculated values from vectors to arrays
   double x_array[],y_array[];
   X.Swap(x_array);
   Y.Swap(y_array);

//--- draw a graph of the calculated vector values
   CurvePlot(x_array,y_array,clrDodgerBlue);

//--- wait for pressing the Escape or PgDn keys to delete the graph (take a screenshot) and exit
   while(!IsStopped())
     {
      if(StopKeyPressed())
         break;
      Sleep(16);
     }

//--- clean up
   ExtGraph.Destroy();
  }
//+------------------------------------------------------------------+
//| When pressing ESC, return 'true'                                 |
//| When pressing PgDn, take a graph screenshot and return 'true'    |
//| Otherwise, return 'false'                                        |
//+------------------------------------------------------------------+
bool StopKeyPressed()
  {
//--- if ESC is pressed, return 'true'
   if(TerminalInfoInteger(TERMINAL_KEYSTATE_ESCAPE)!=0)
      return(true);
//--- if PgDn is pressed and a graph screenshot is successfully taken, return 'true'
   if(TerminalInfoInteger(TERMINAL_KEYSTATE_PAGEDOWN)!=0 && MakeAndSaveScreenshot(MQLInfoString(MQL_PROGRAM_NAME)+"_Screenshot"))
      return(true);
//--- return 'false'
   return(false);
  }
//+------------------------------------------------------------------+
//| Create a graph object and draw a curve                           |
//+------------------------------------------------------------------+
void CurvePlot(double &x_array[], double &y_array[], const color colour)
  {
   ExtGraph.Create(ChartID(), "Graphic", 0, 0, 0, GRAPH_WIDTH, GRAPH_HEIGHT);
   ExtGraph.CurveAdd(x_array, y_array, ColorToARGB(colour), CURVE_LINES);
   ExtGraph.IndentUp(30);
   ExtGraph.CurvePlotAll();
   string text1="Press ESC to delete the graph and stop the script, or";
   string text2="Press PgDn to create a screen, delete the graph and stop the script";
   ExtGraph.TextAdd(54, 9, text1, ColorToARGB(clrBlack));
   ExtGraph.TextAdd(54,21, text2, ColorToARGB(clrBlack));
   ExtGraph.Update();
  }
//+------------------------------------------------------------------+
//| Take a screenshot and save the image to a file                   |
//+------------------------------------------------------------------+
bool MakeAndSaveScreenshot(const string file_name)
  {
   string file_names[];
   ResetLastError();
   int selected=FileSelectDialog("Save Picture", NULL, "All files (*.*)|*.*", FSD_WRITE_FILE, file_names, file_name+".png");
   if(selected<1)
     {
      if(selected<0)
         PrintFormat("%s: FileSelectDialog() function returned error %d", __FUNCTION__, GetLastError());
      return false;
     }

   bool res=false;
   if(ChartSetInteger(0,CHART_SHOW,false))
      res=ChartScreenShot(0, file_names[0], GRAPH_WIDTH, GRAPH_HEIGHT);
   ChartSetInteger(0,CHART_SHOW,true);
   return(res);
  }
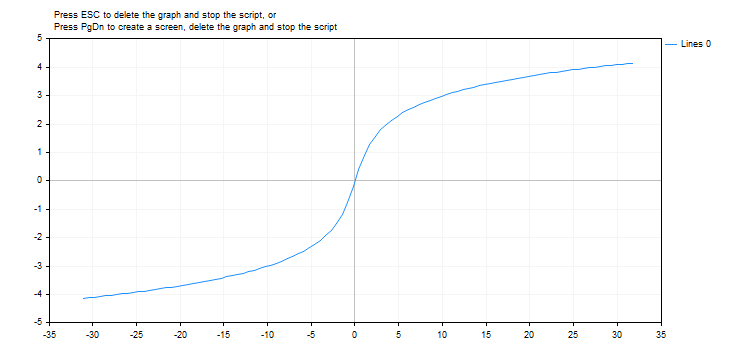
Result:
See also
Real types (double, float), Statistics, Scientific Charts, Client Terminal Properties
Last updated on